Project Detail
Wind Tunnel Simulation: Fan Design & Thermal Flow Analysis
Full design and simulation study of an axial fan in SolidWorks, from component modelling through assembly to external flow simulation and wind-tunnel thermal analysis. A fin heated to 50 W was placed inside the tunnel and fan speed was varied to observe the effect on temperature distribution across the fin surface and the downstream fluid.
Project Overview
The goal of this study was to develop familiarity with complex SolidWorks design features and the Flow Simulation package. The work progressed in two phases: first designing and assembling a fully parametric axial fan from individual components, then using that fan inside a custom wind tunnel to simulate forced convection over a heated fin at multiple operating speeds. All cases are run at basic mesh settings for quick evaluation.
Skills developed: Product design · Flow Simulation · Motion study · Assembly modelling
Part 1, Fan Design & Assembly
Each component of the fan was modelled individually before being assembled into a complete unit.
Components
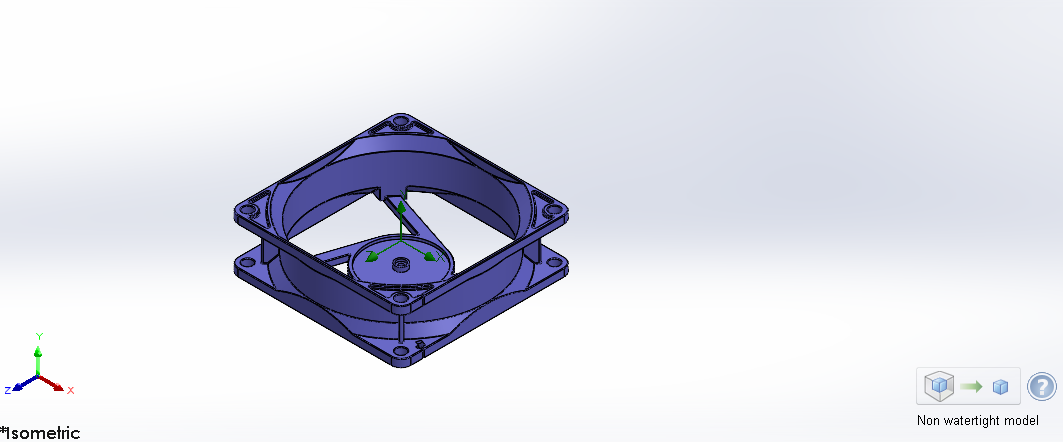
Fan housing
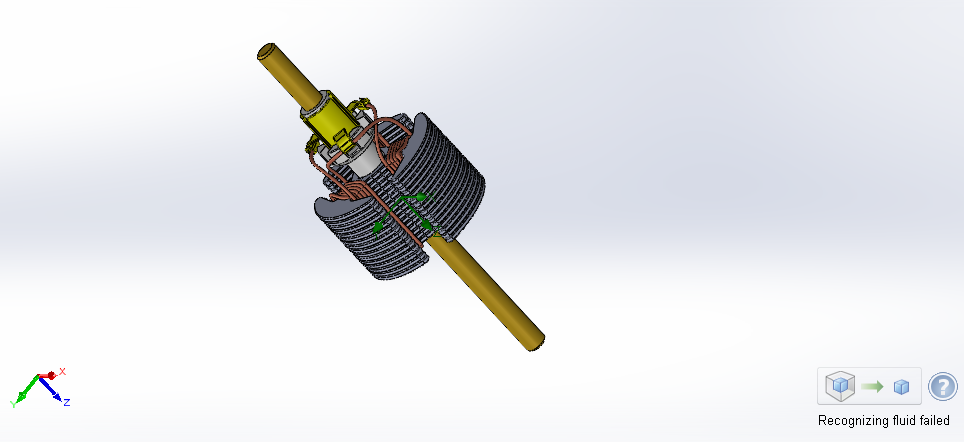
Coil & motor
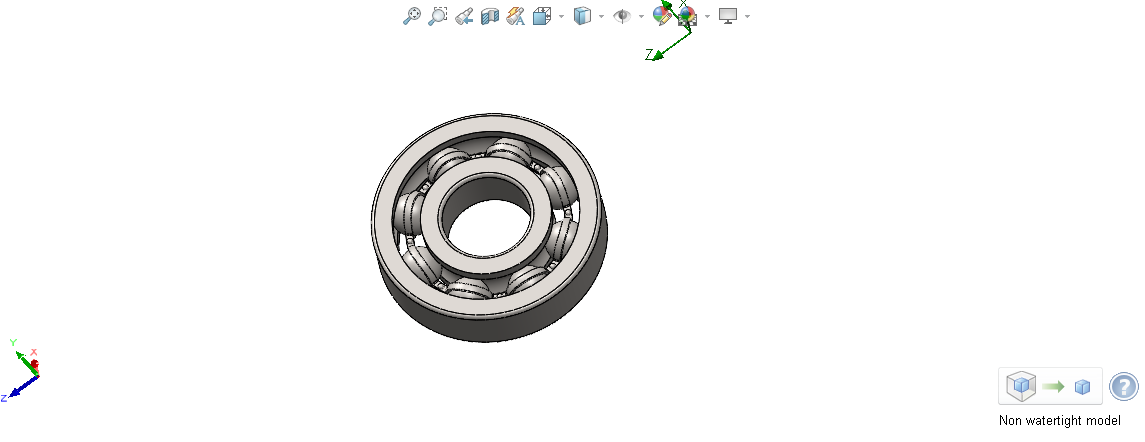
Ball bearing
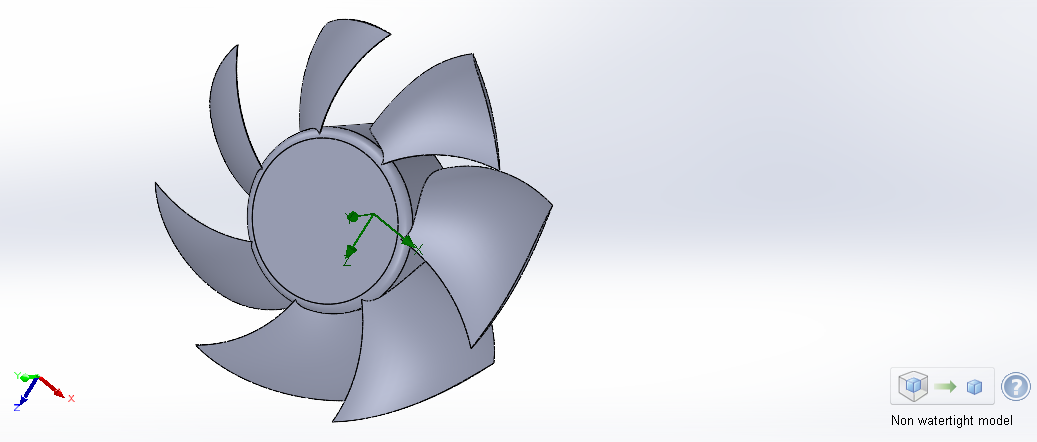
Propeller (7-blade)
Assembly & Exploded View
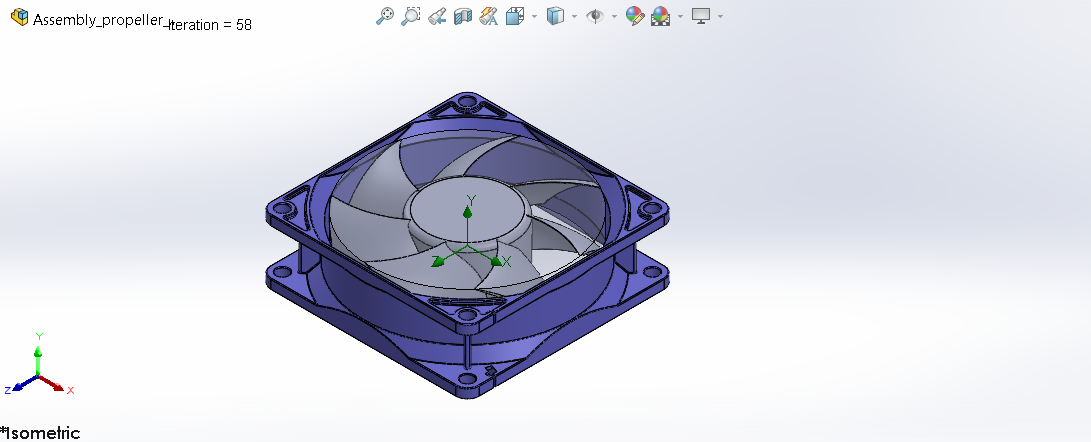
Fully assembled fan
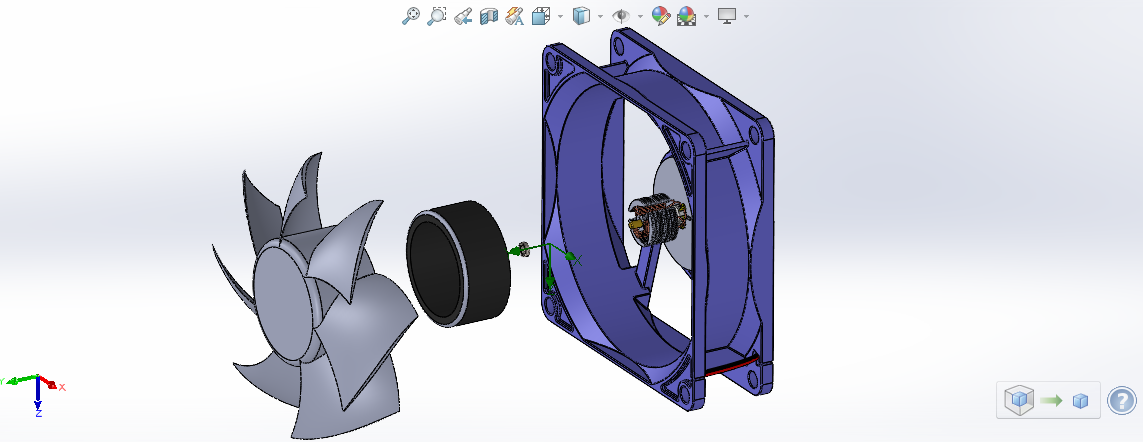
Exploded view
Part 2, Wind Tunnel: Flow Over a Heated Fin
A complete wind tunnel was modelled around the fan, including a flow straightener, contraction, working/test section, and diffuser. A thin fin was placed in the centre of the test section and assigned a surface heat source of 50 W. Flow Simulation was run at three fan speeds, 1000 rps, 800 rps, and 200 rps, to observe how airflow velocity affects temperature distribution on the fin and in the downstream fluid.
Expected trend: as fan speed decreases, the fin spends longer in contact with slower-moving air, so both fin surface temperature and downstream fluid temperature rise.
Fin Surface Temperature
Temperature contours mapped directly onto the fin surface show how heat builds up as fan speed drops.
Fin surface, 1000 rps · Tmax = 34.94 °C
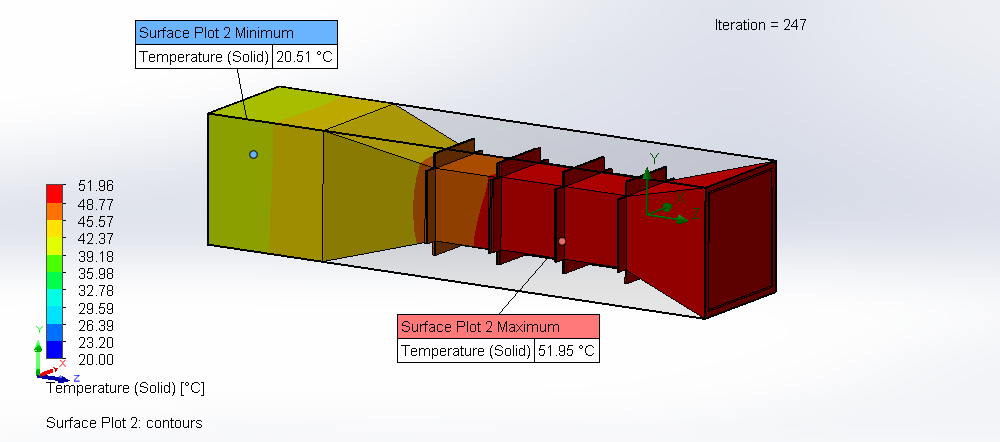
Fin surface, 200 rps · Tmax = 51.95 °C
At 1000 rps the fin peaks at 34.94 °C; reducing to 200 rps raises the peak to 51.95 °C, a 17 °C increase from halved airflow alone.
Fluid Temperature Distribution
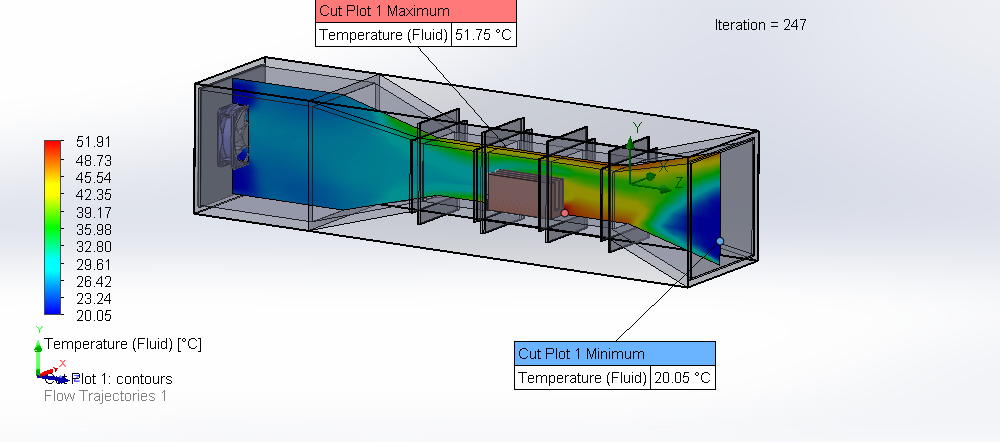
Cut plots through the tunnel show how heat transfers into the air passing over the fin.
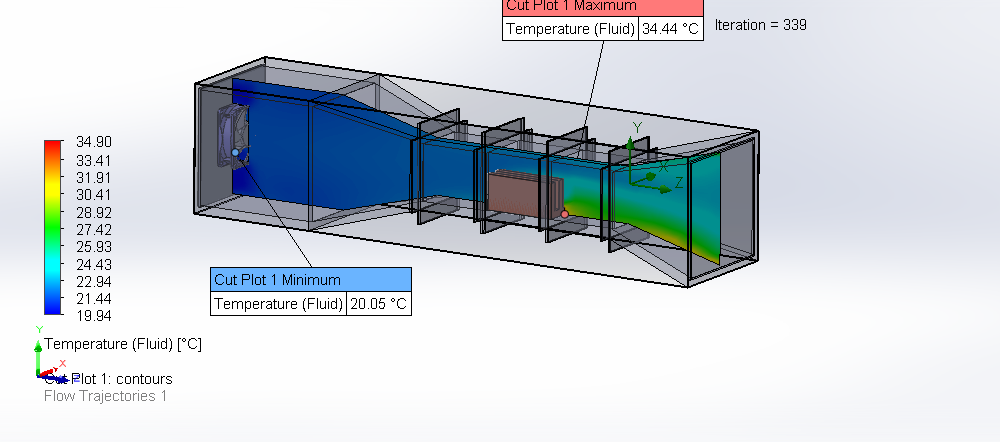
Fluid cut plot, 1000 rps · Tmax = 34.44 °C
Fluid cut plot, 200 rps · Tmax = 51.75 °C
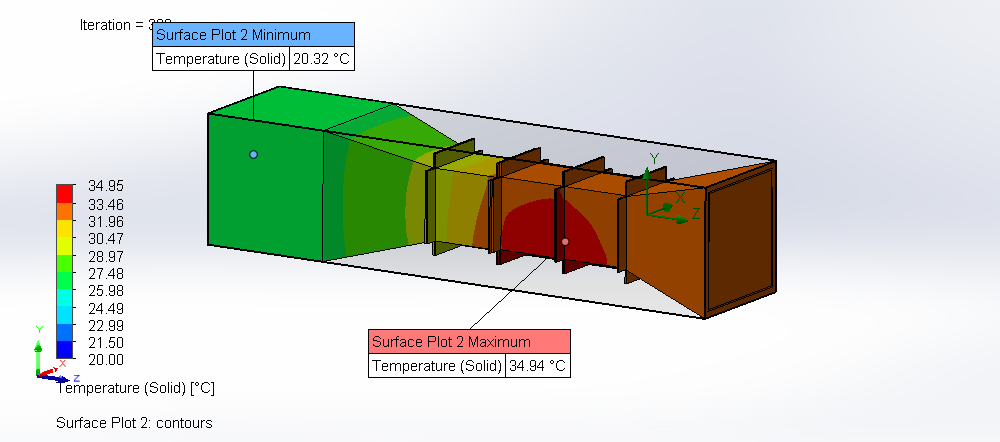
Solid Surface Temperature, Full Tunnel
Solid surface contours across the entire tunnel assembly confirm that structural heat soak increases significantly at lower fan speeds.
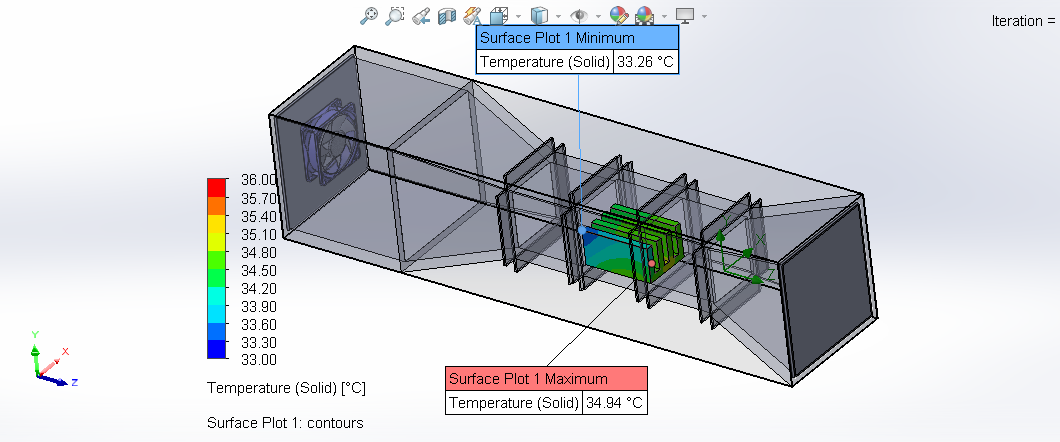
Tunnel solid, 1000 rps · Tmin = 33.26 °C, Tmax = 34.94 °C
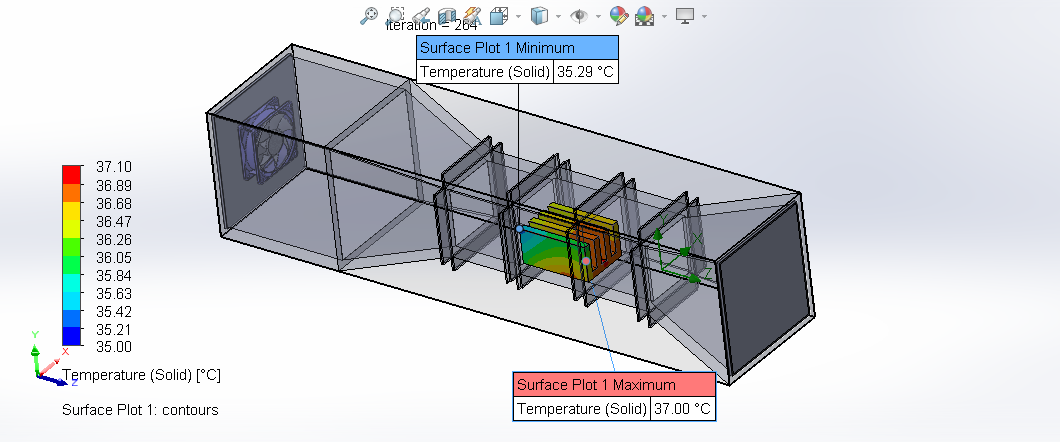
Tunnel solid, 800 rps · Tmin = 35.29 °C, Tmax = 37.00 °C
Key Observations
| Fan speed | Fin Tmax (°C) | Fluid Tmax (°C) |
|---|---|---|
| 1000 rps | 34.94 | 34.44 |
| 800 rps | ~37.00 | , |
| 200 rps | 51.95 | 51.75 |
- Reducing fan speed from 1000 rps to 200 rps increases peak fin temperature by ~17 °C (50% rise).
- Fluid temperature closely tracks fin surface temperature, confirming efficient convective coupling between the fin and airstream.
- All simulations used a basic mesh; refined settings using ANSYS Workbench could improve accuracy for production analysis.
Next Steps
- Mount the fan directly adjacent to the fin to characterise near-field turbulence effects on heat transfer.
- Introduce a circular cylinder in the test section to observe vortex shedding at low Reynolds numbers.
- Refine mesh and compare results against analytical correlations for forced convection over a flat plate.