Project Detail
Shell & Tube Heat Exchanger: Flow Simulation & CHT Study
Four-case SolidWorks Flow Simulation conjugate heat transfer study on a water-water shell and tube exchanger: counterflow baseline, parallel-flow comparison, tube-side inlet optimization, and increased shell-side velocity. Documents heat duty, bulk outlet temperatures, tube and shell pressure drop, and energy balance with gravity disabled for pump-driven forced convection.
What Is This Study About?
Shell and tube heat exchangers transfer duty between two fluids separated by tube walls. Performance depends on flow arrangement, inlet routing, shell-side passage velocities, and accurate conjugate coupling between fluid and metal. This project uses SolidWorks Flow Simulation with conjugate heat transfer enabled so tube-wall conduction is resolved together with water domains on the tube and shell sides.
The objectives were to establish a validated baseline, test counterflow vs parallel labeling when baffles drive cross-flow on the shell side, compare an inline tube-side inlet refinement against baseline, and quantify the trade-off when shell-side velocity is doubled. Final reporting uses bulk-average outlet temperatures, heat duty, tube and shell pressure drop, and energy balance checks between hot and cold streams.
Physical Setup & Geometry
The model is a shell and tube exchanger with copper tubes and stainless steel shell, headers, baffles, and tube sheets. Flow is internal to the fluid volumes with heat conduction in solids active so heat crosses the tube walls realistically.
- Hot side: tube-side water (100 °C inlet class in the final report setup).
- Cold side: shell-side water (20 °C inlet; velocity stepped for Case 4).
- Exterior: treated as adiabatic so losses do not mask internal balances.
All final cases were run with gravity off. That matches a pump-driven, forced-convection water-water exchanger: hydrostatic head is removed from the reported pressure drops so comparisons isolate friction and dynamic losses.
Simulation Setup
| Parameter | Final-report setting |
|---|---|
| Analysis type | Internal flow, steady-state |
| Thermal model | Conjugate heat transfer; conduction in solids |
| Fluids | Water (tube and shell) |
| Solids | Copper tubes; stainless steel shell, headers, baffles, tube sheets |
| Wall condition (external) | Adiabatic |
| Gravity | Off |
| Radiation | Off |
| Primary readouts | Bulk-average fluid temperatures; mass flows; tube / shell Δp; heat transfer (kW) |
Boundary conditions (summary)
| Location | Case 1-3 | Case 4 | Notes |
|---|---|---|---|
| Hot tube-side inlet | Prescribed flow / equivalent inlet | Same as Case 3 | 100 °C per final report |
| Hot tube-side outlet | Environmental pressure (101,325 Pa ref) | Same | Outlet temperature from solution |
| Cold shell-side inlet | 0.1 m/s | 0.2 m/s | Case 4 doubles shell-side velocity |
| Cold shell-side outlet | Environmental pressure | Same | Outlet temperature from solution |
Mesh & comparison discipline
A local mesh strategy concentrates refinement at the tube bundle, baffles, tube sheets, and shell passages where gradients are highest. The same mesh philosophy is carried across the four cases so differences reflect geometry and boundary conditions, not inconsistent mesh density.
Heat duty is checked using hot-side and cold-side energy balances (for example Q = ṁ Cp ΔT with Cp ≈ 4180 J/(kg·K) for water).
Design Case Overview
| Case | Configuration | Hot outlet (°C) | Cold outlet (°C) | Heat transfer (kW) | Tube Δp (Pa) | Shell Δp (Pa) |
|---|---|---|---|---|---|---|
| 1 | Baseline counterflow HX | 86.71 | 24.80 | 26.3 | 10.69 | 21.06 |
| 2 | Parallel-flow comparison | 87.15 | 24.57 | 25.2 | 10.70 | 20.52 |
| 3 | Inline tube-side inlet optimisation | 86.22 | 24.96 | 27.2 | 9.82 | 21.11 |
| 4 | Increased shell-side velocity | 84.75 | 22.72 | 30.0 | 9.82 | 83.58 |
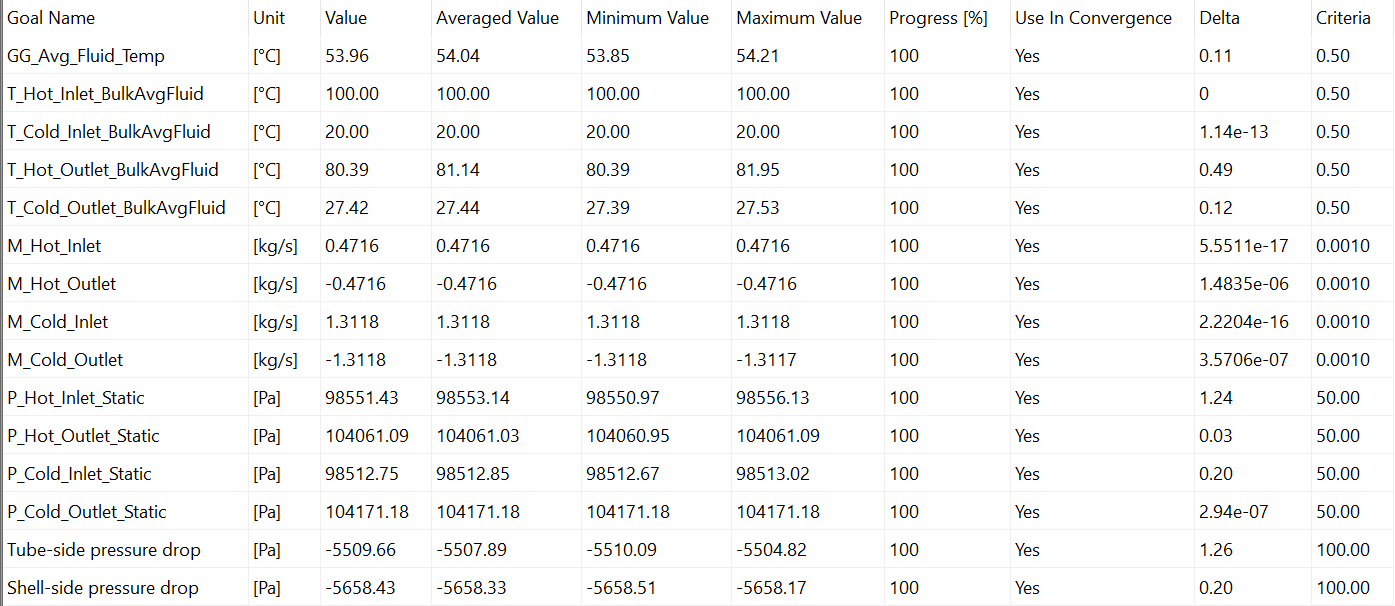
Detailed energy balance snapshot
| Case | ṁ hot (kg/s) | ṁ cold (kg/s) | Q hot (kW) | Q cold (kW) | Energy error (%) |
|---|---|---|---|---|---|
| 1 | 0.4716 | 1.3118 | 26.2 | 26.3 | 0.46 |
| 2 | 0.4716 | 1.3125 | 25.3 | 25.1 | 1.03 |
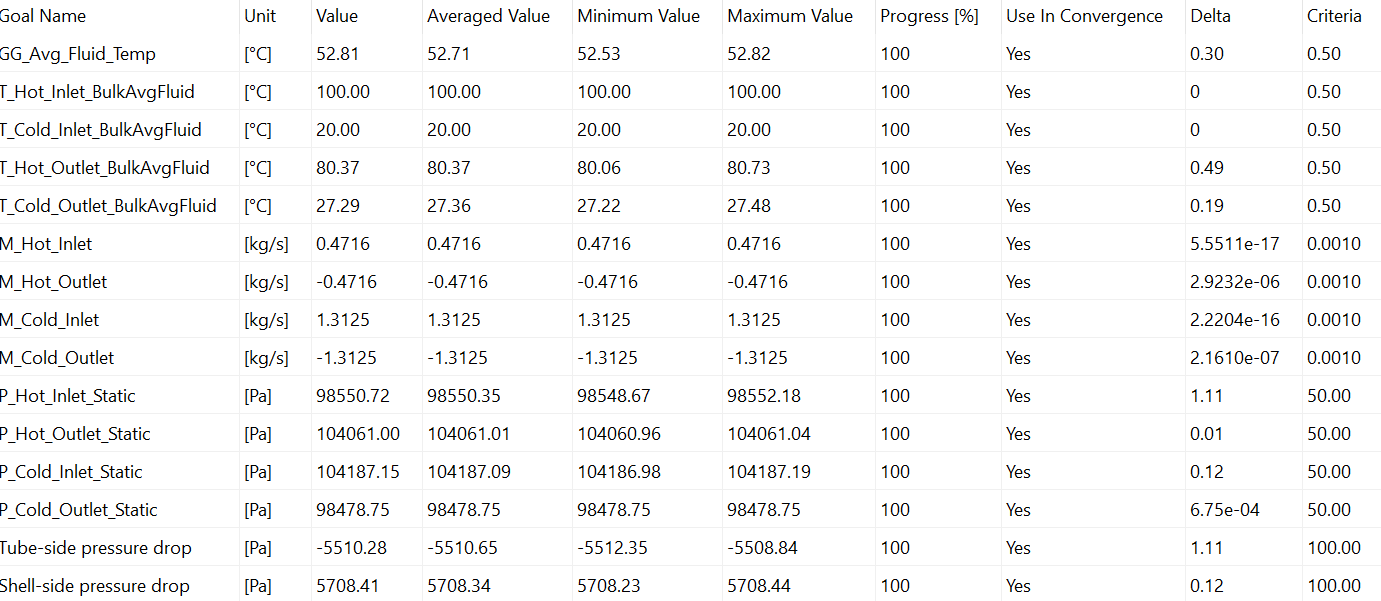
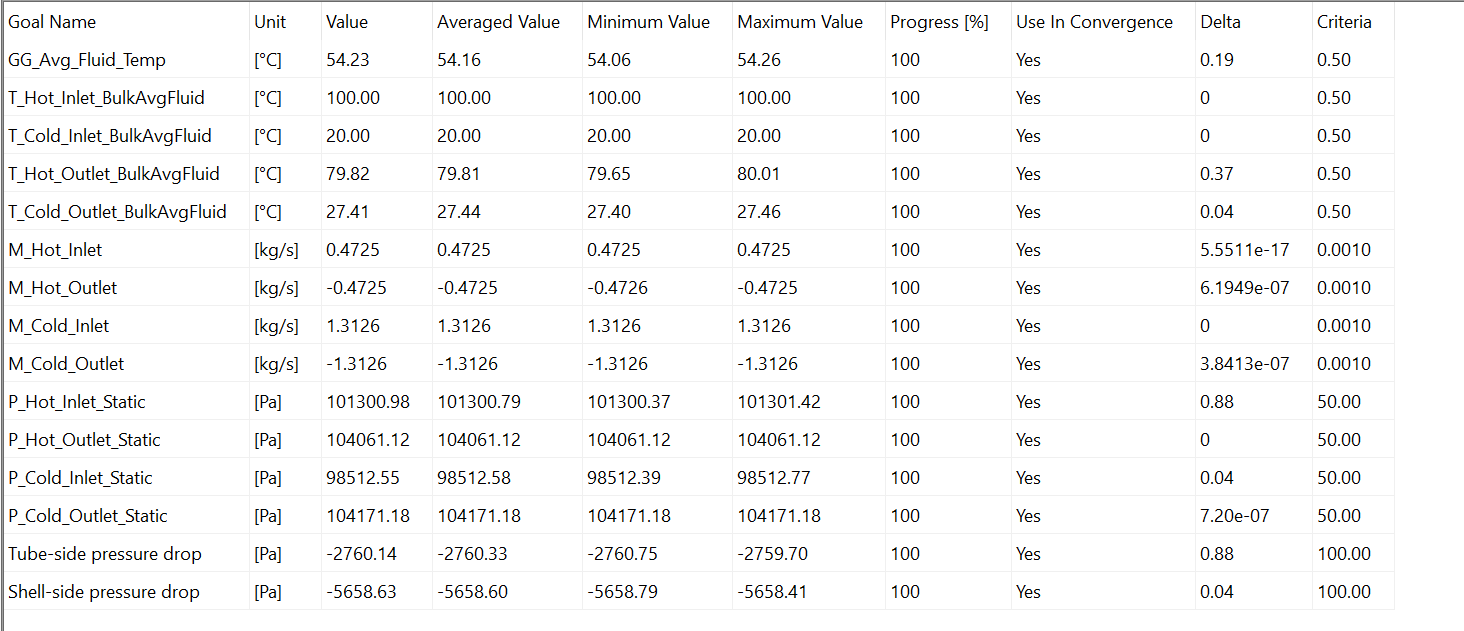
| 3 | 0.4725 | 1.3126 | 27.2 | 27.2 | 0.01 |
| 4 | 0.4725 | 2.6252 | 30.1 | 29.8 | 0.91 |
Interpretation: Case 4 maximises heat transfer but pays a large shell-side Δp penalty. Case 3 improves duty versus baseline while lowering tube-side Δp, the strongest balanced option when pumping power matters.
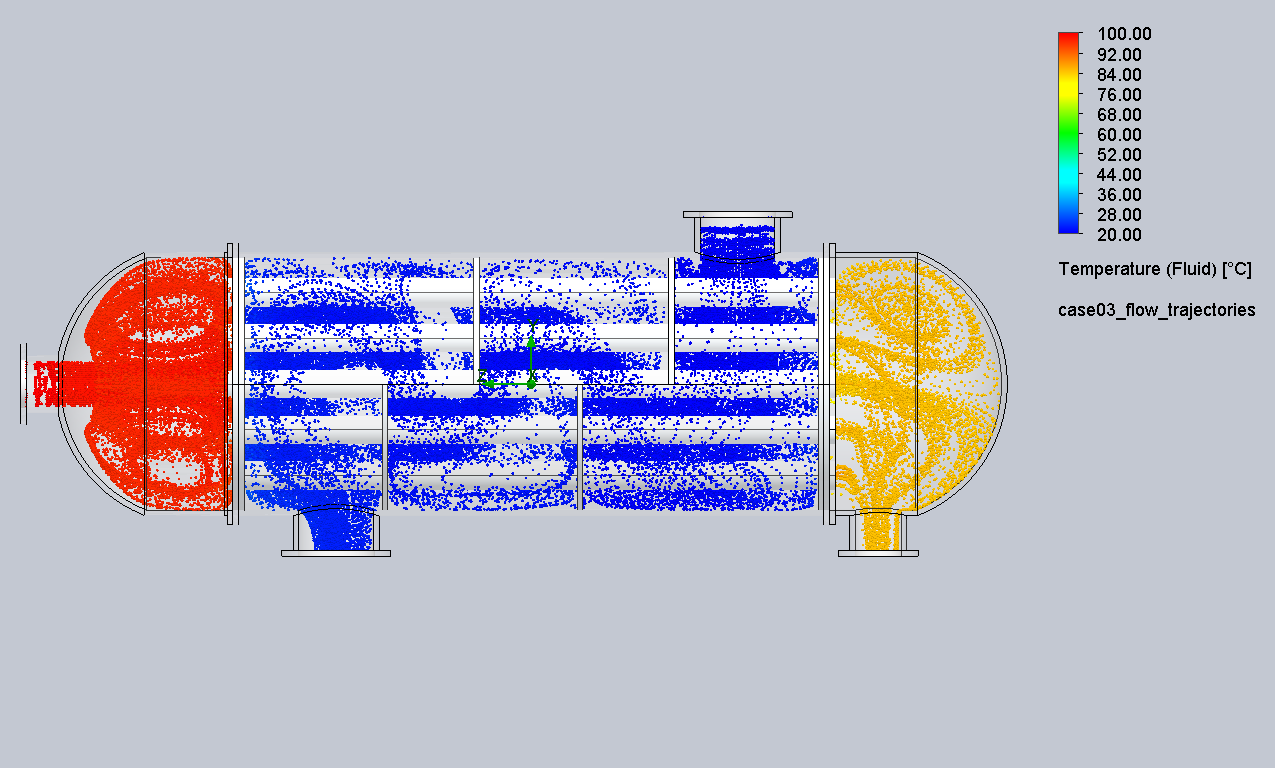
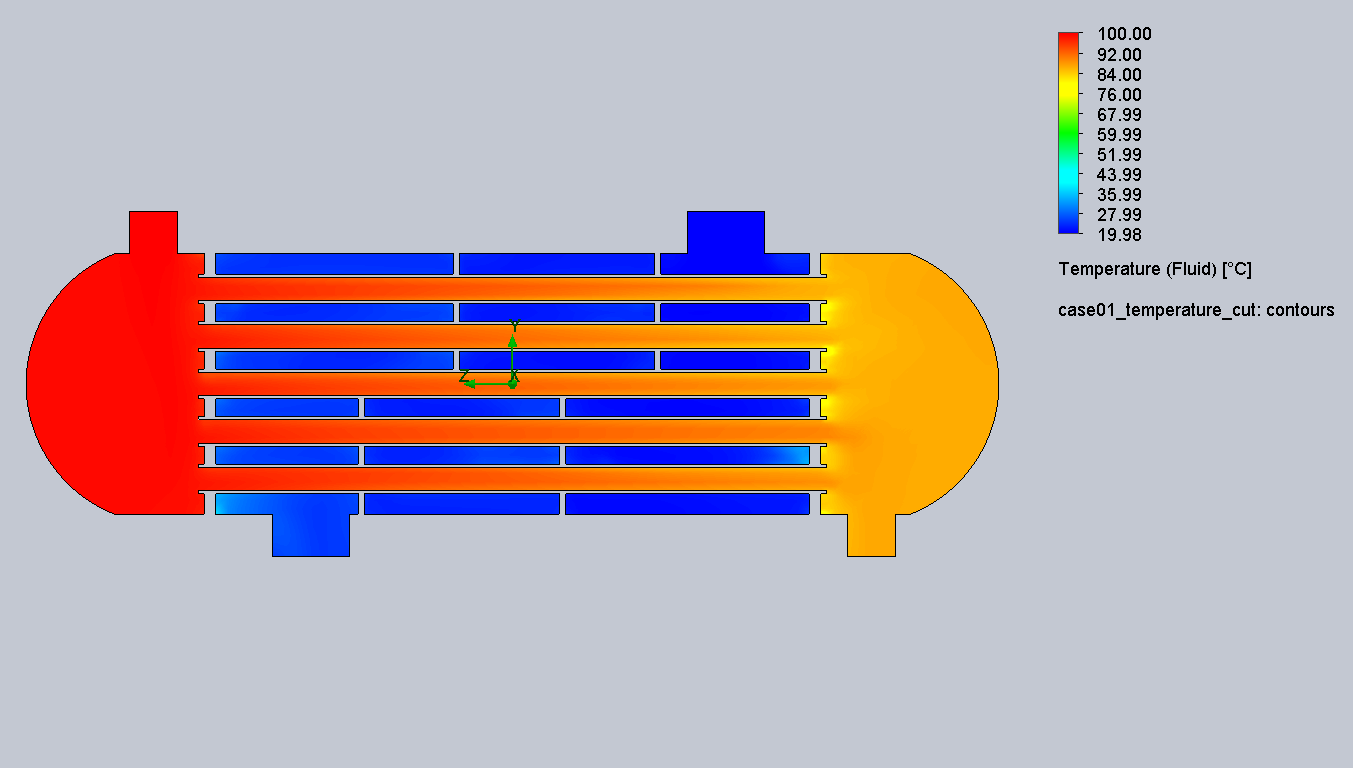
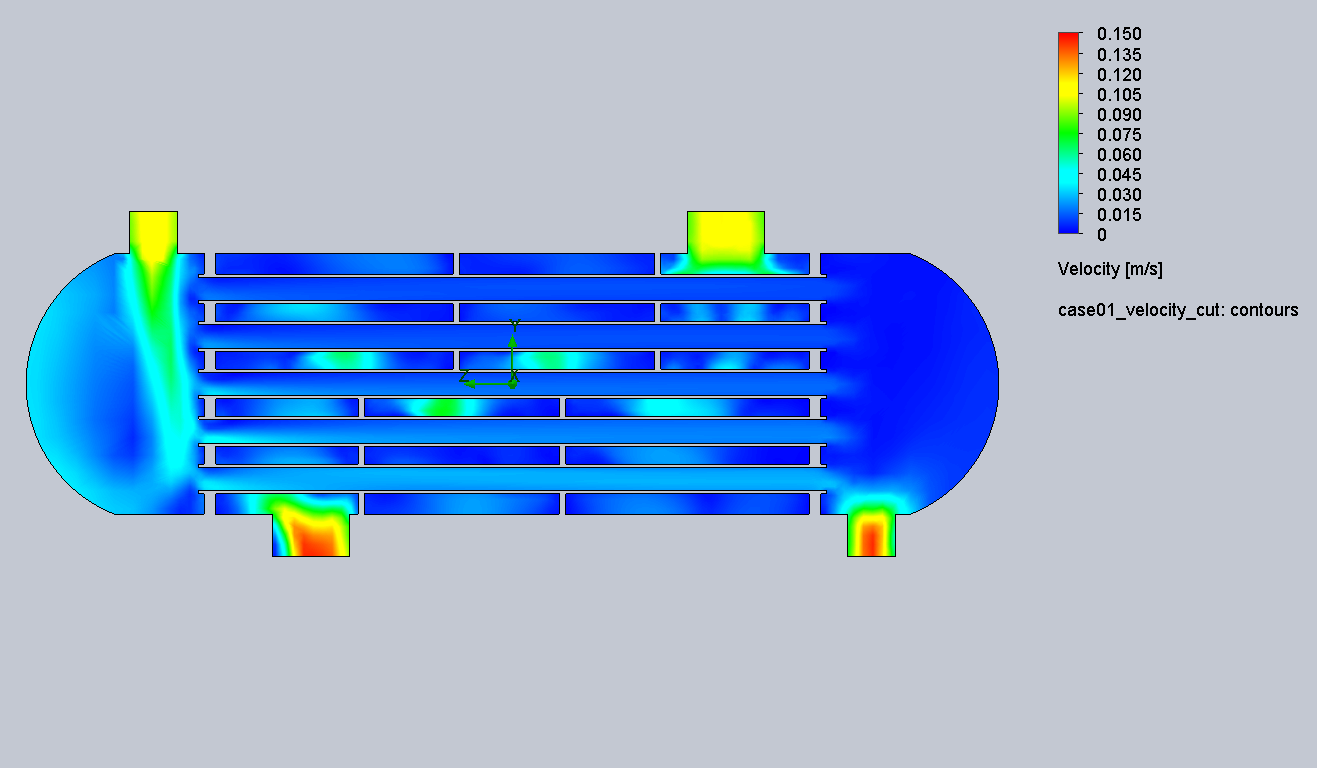
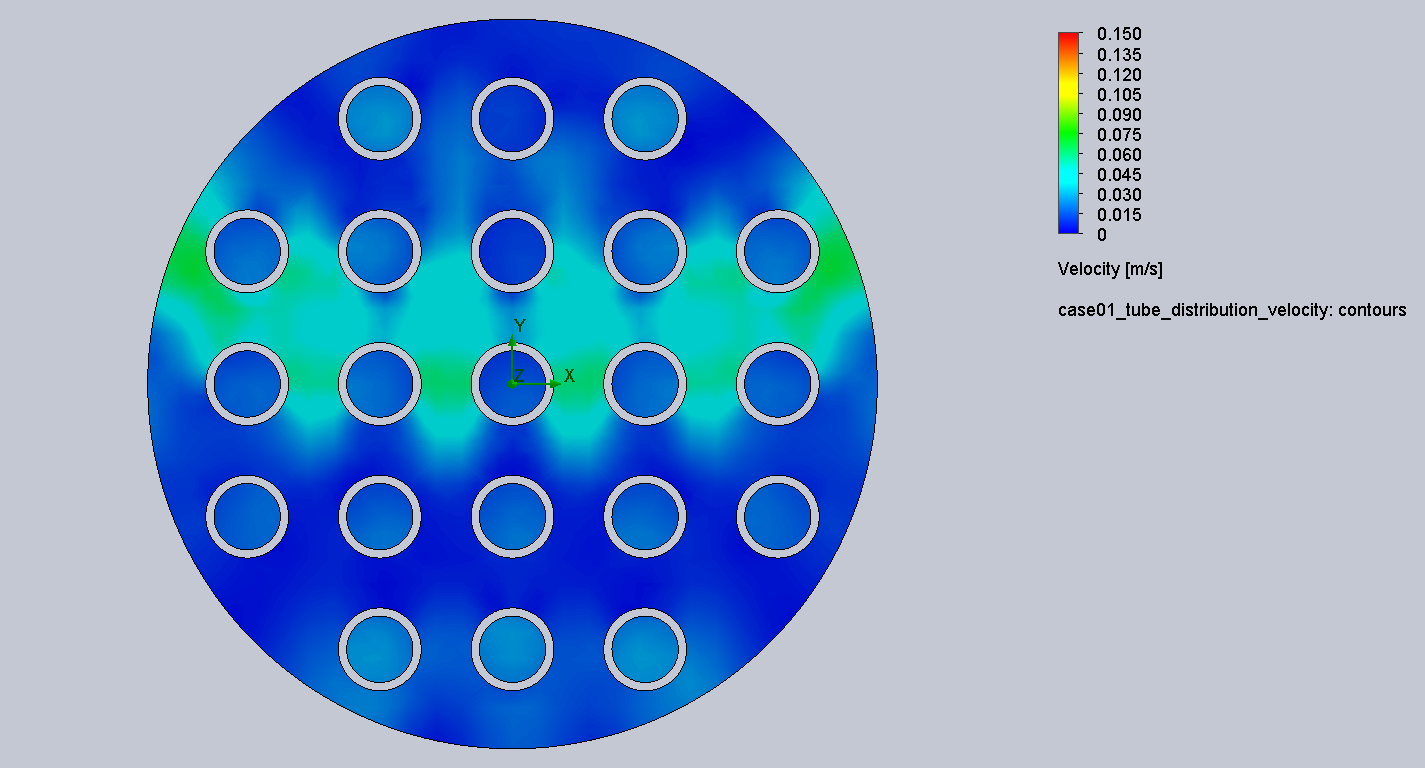
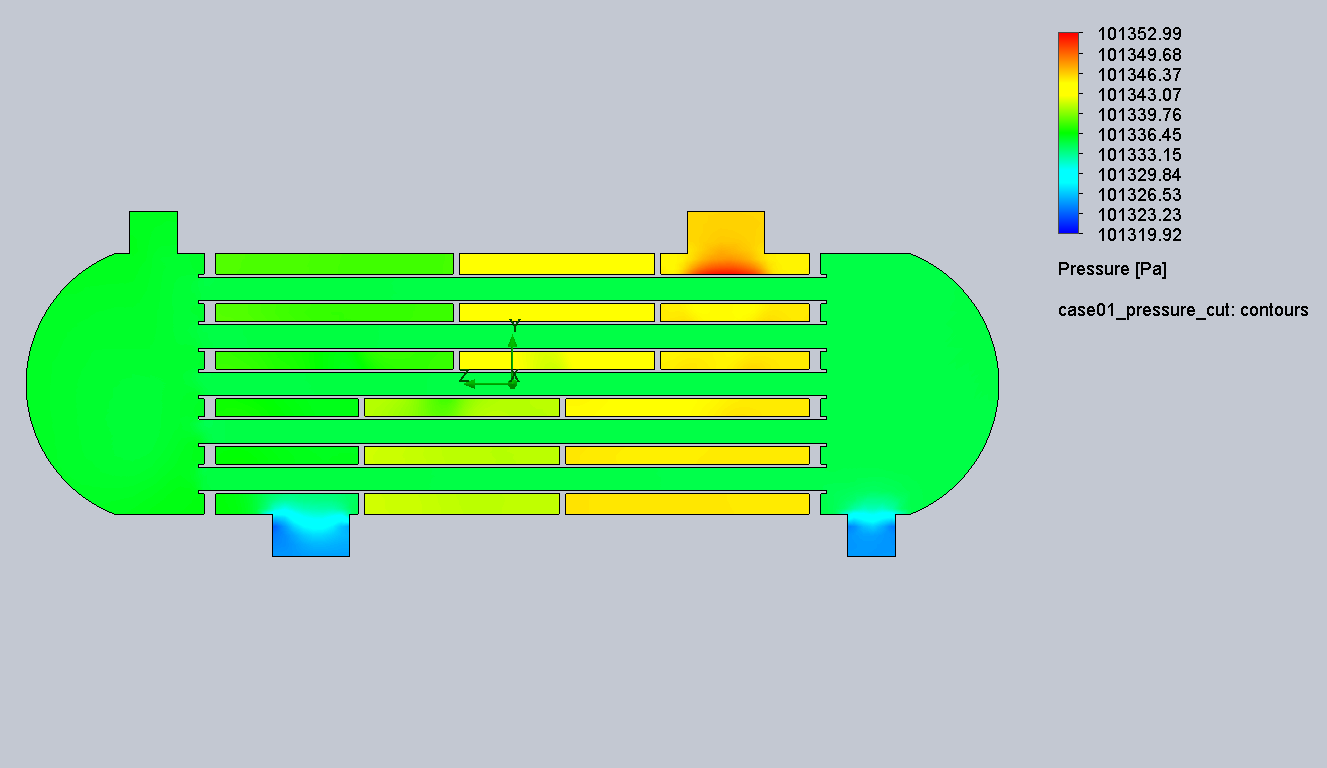
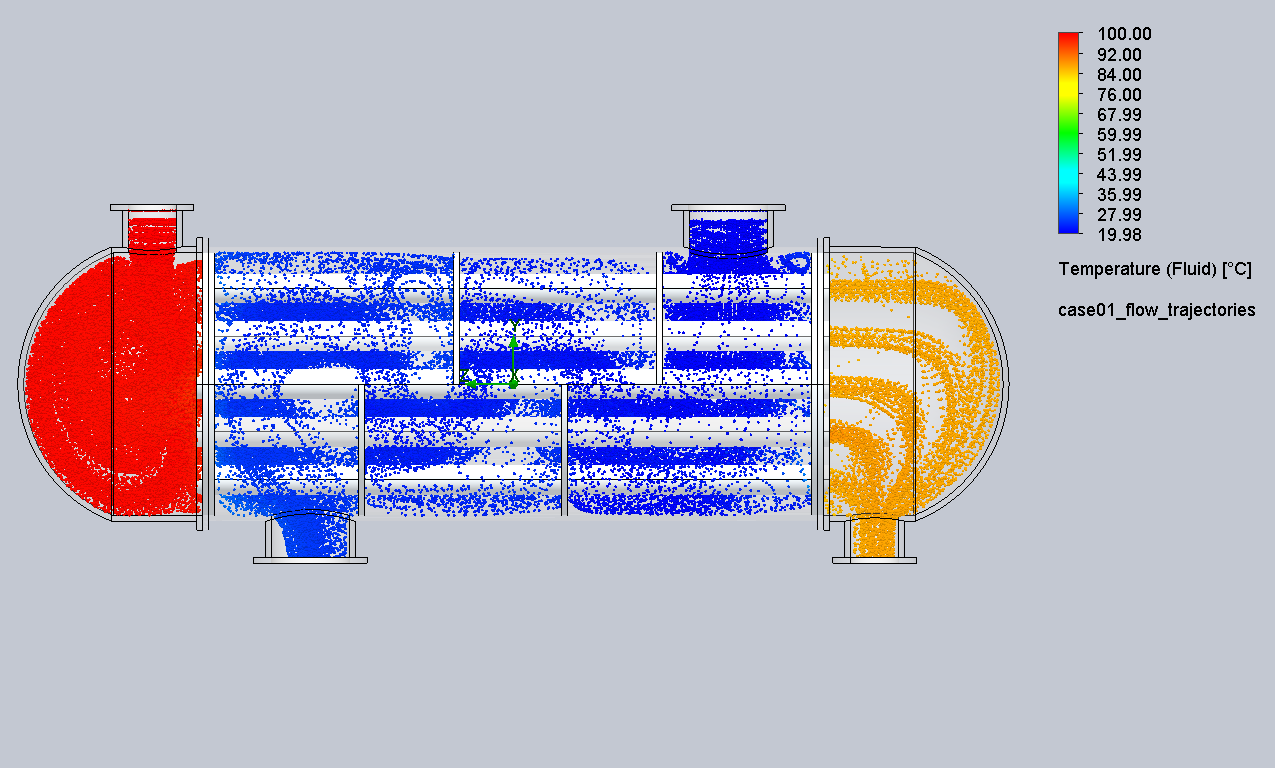
Case 1: Baseline Counterflow HX
Validated baseline: counterflow arrangement, local mesh around the bundle, copper tubes and stainless shell, bulk-average temperature goals.
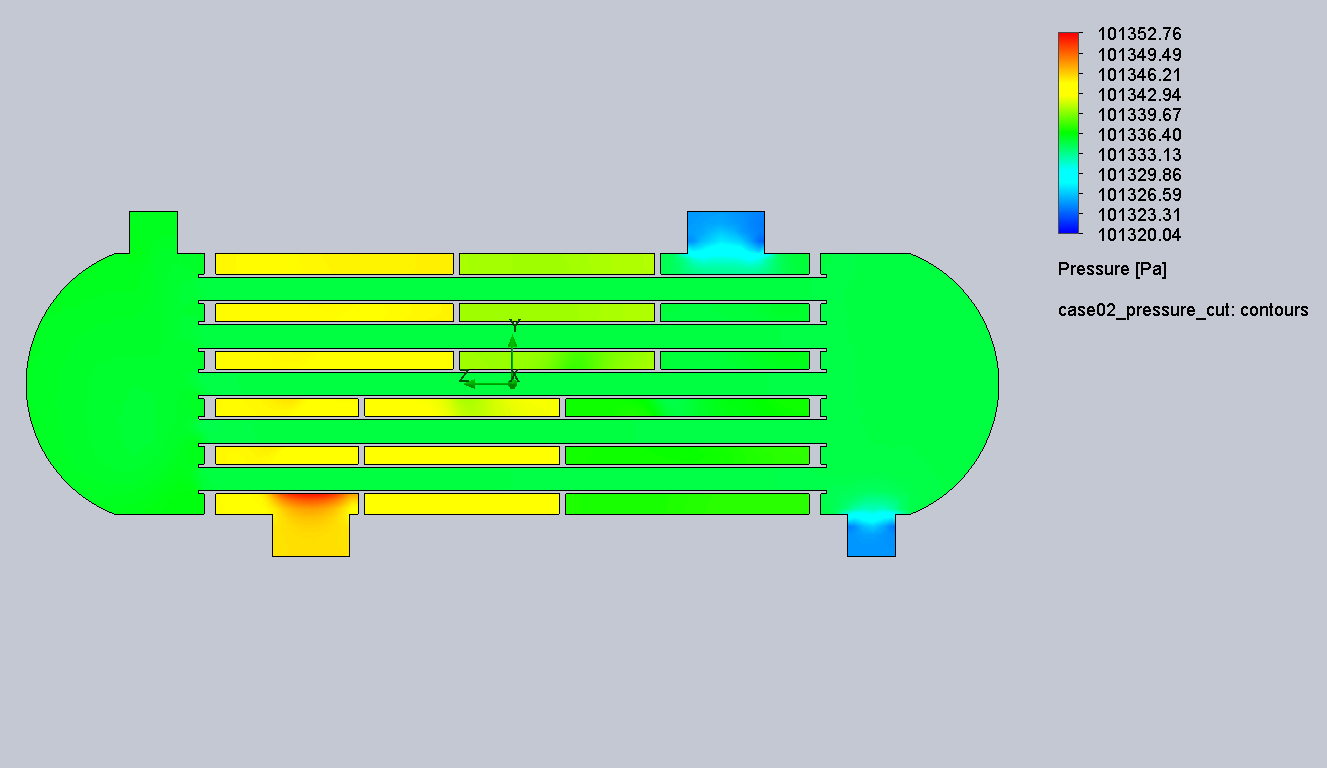
Headline metrics: Hot outlet 86.71 °C · Cold outlet 24.80 °C · Heat transfer ~26.3 kW · Tube Δp 10.69 Pa · Shell Δp 21.06 Pa · Energy balance 0.46%
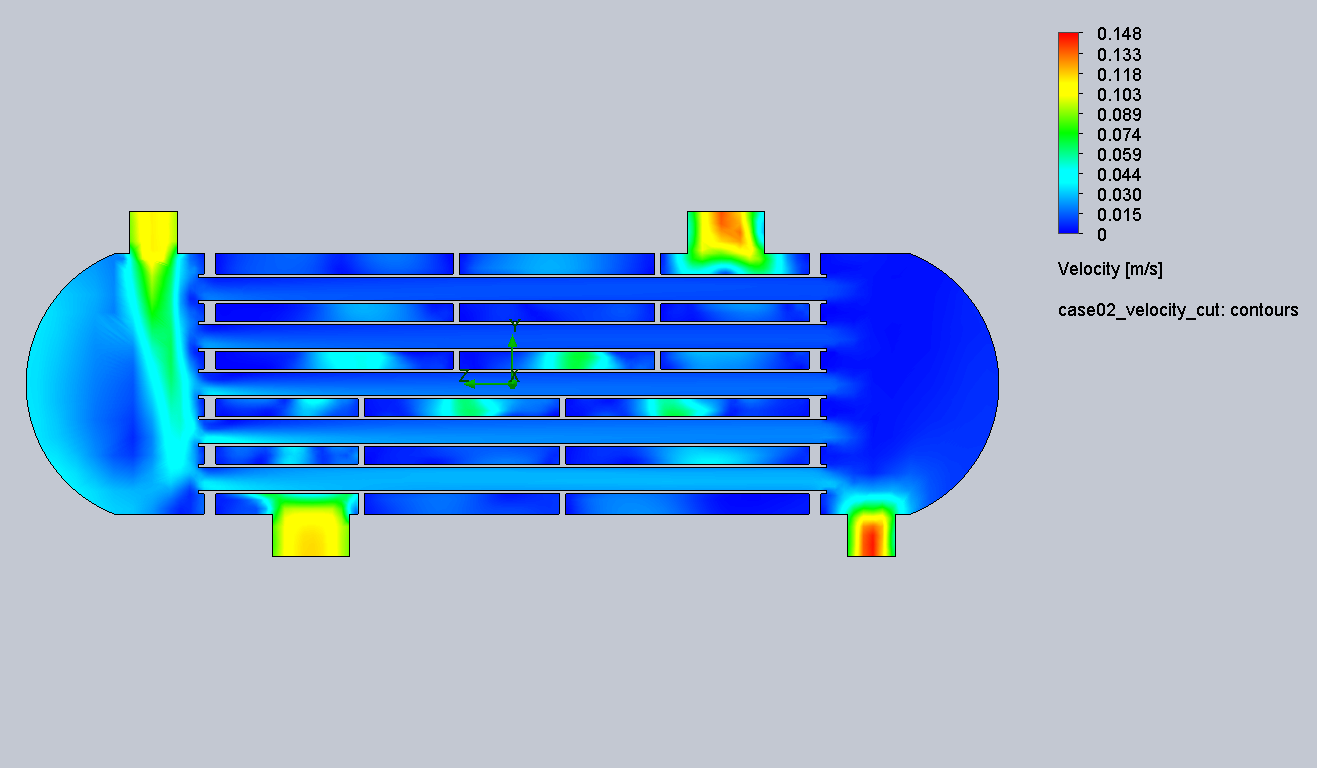
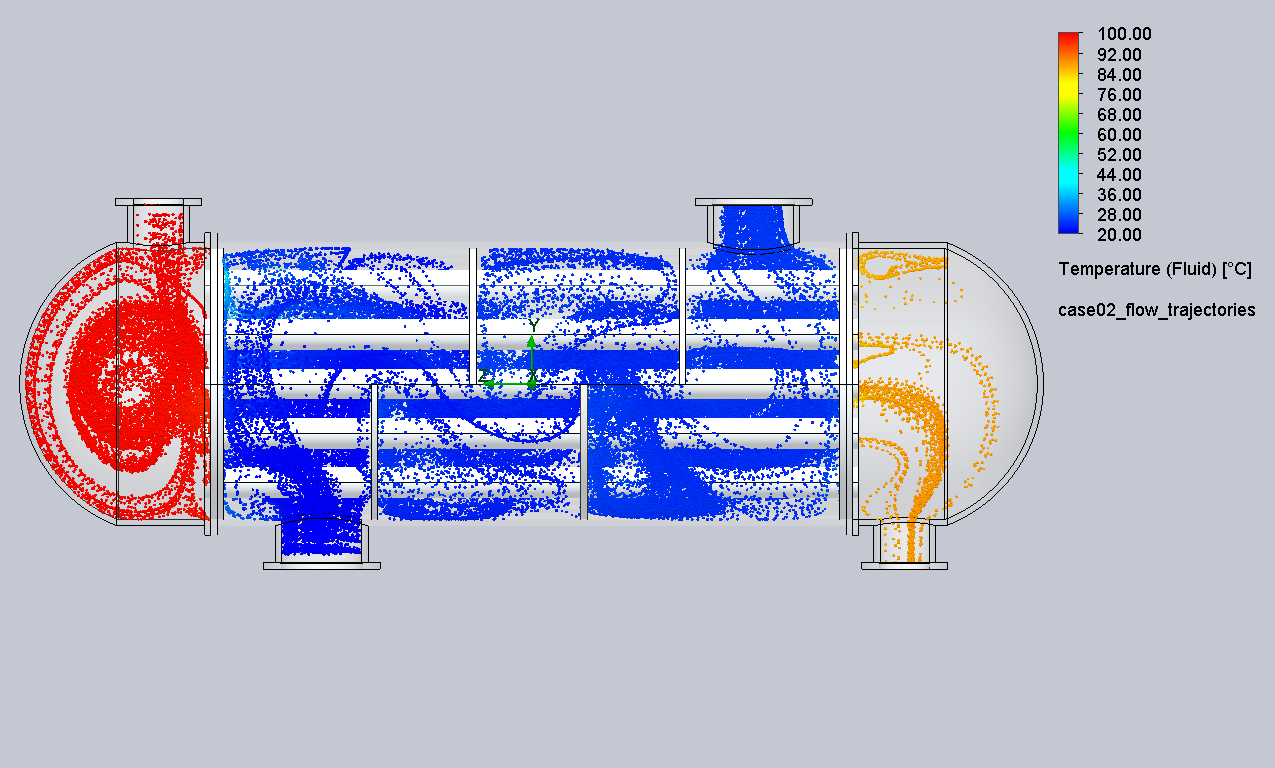
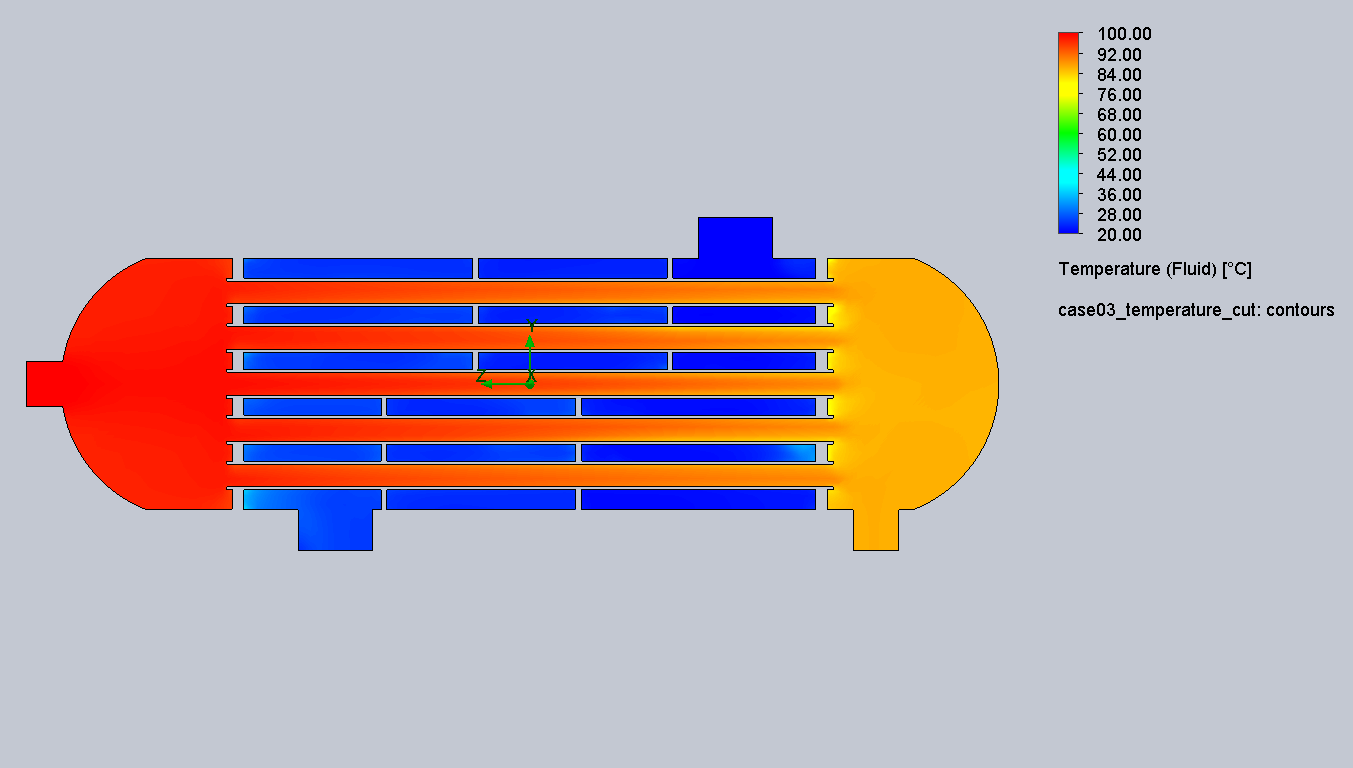
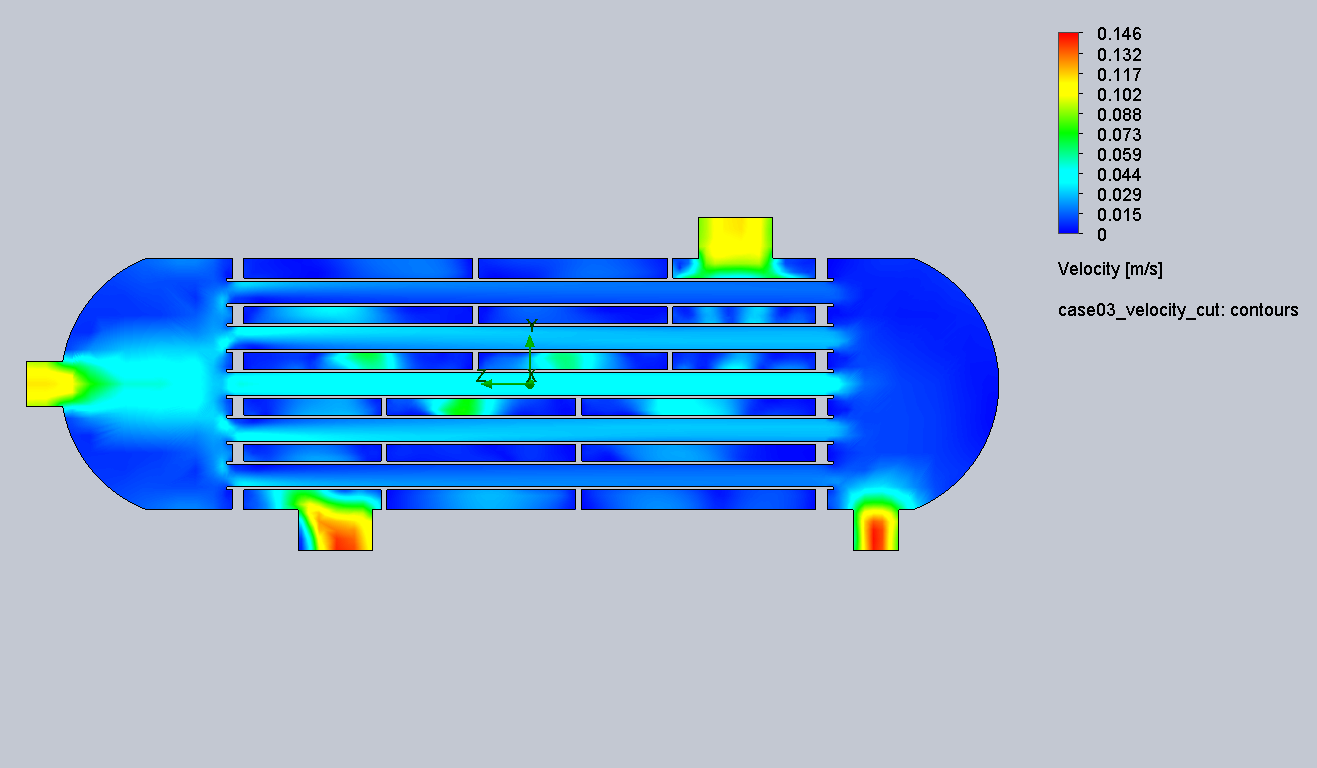
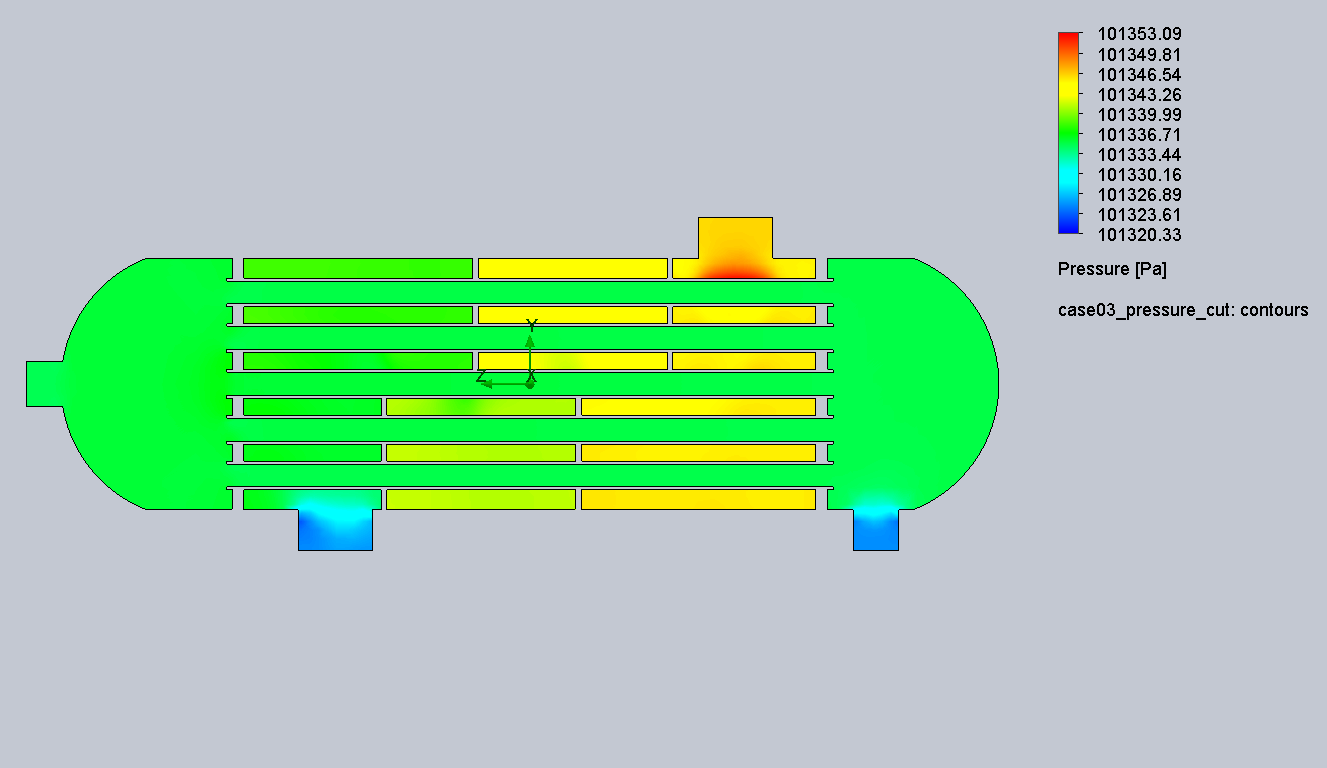
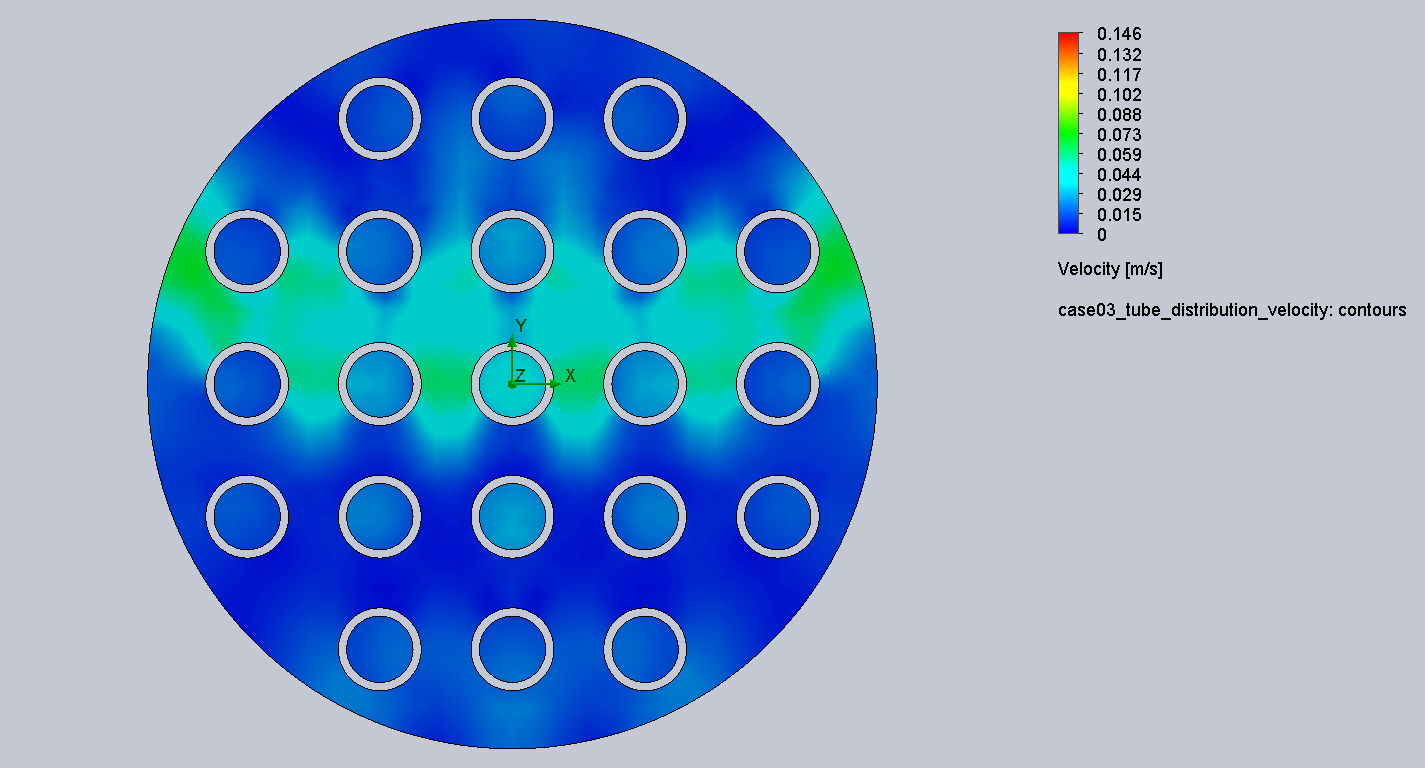
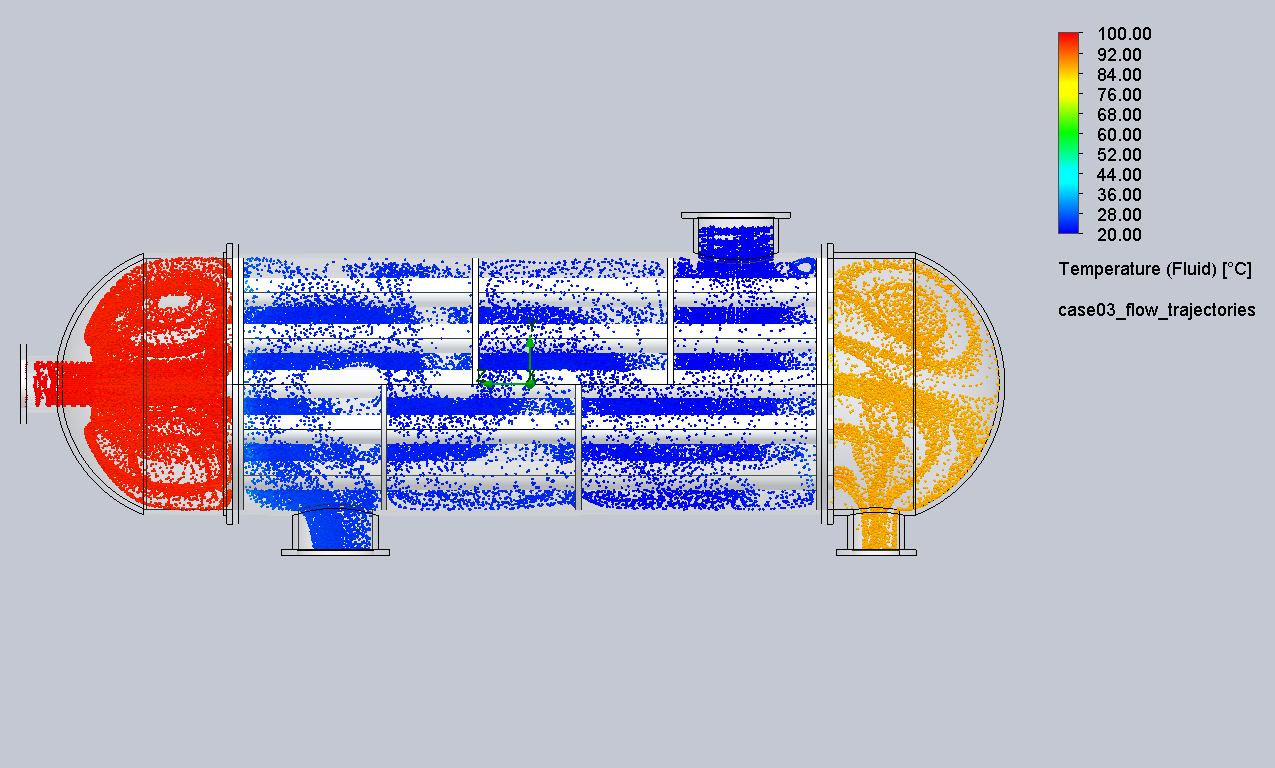
Temperature and velocity fields show hot fluid cooling along the tubes and cold fluid picking up energy on the shell side. Trajectories illustrate how baffles redirect shell-side passage flow through the bundle.
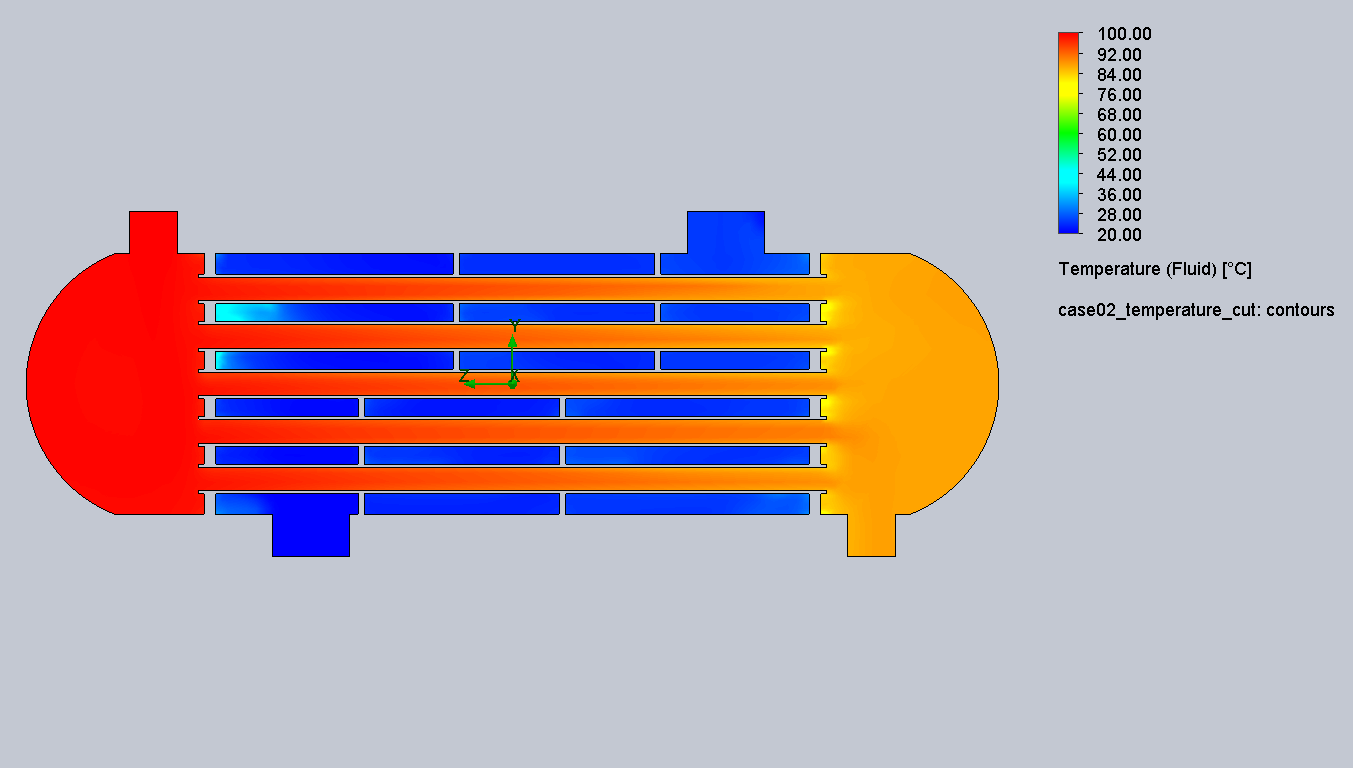
Case 2: Parallel-Flow Comparison
Shell-side flow direction is reversed to compare the baseline counterflow arrangement against a parallel-flow arrangement. Duty drops slightly versus Case 1 (25.2 kW vs 26.3 kW); hot outlet moves to 87.15 °C.
The change is modest because the shell side does not behave like ideal one-dimensional parallel or counter flow: baffles enforce cross-flow and mixing, so textbook arrangement trends are muted.
Headline metrics: Hot outlet 87.15 °C · Cold outlet 24.57 °C · Heat transfer 25.2 kW · Tube Δp 10.70 Pa · Shell Δp 20.52 Pa
Case 3: Inline Tube-Side Inlet Optimisation
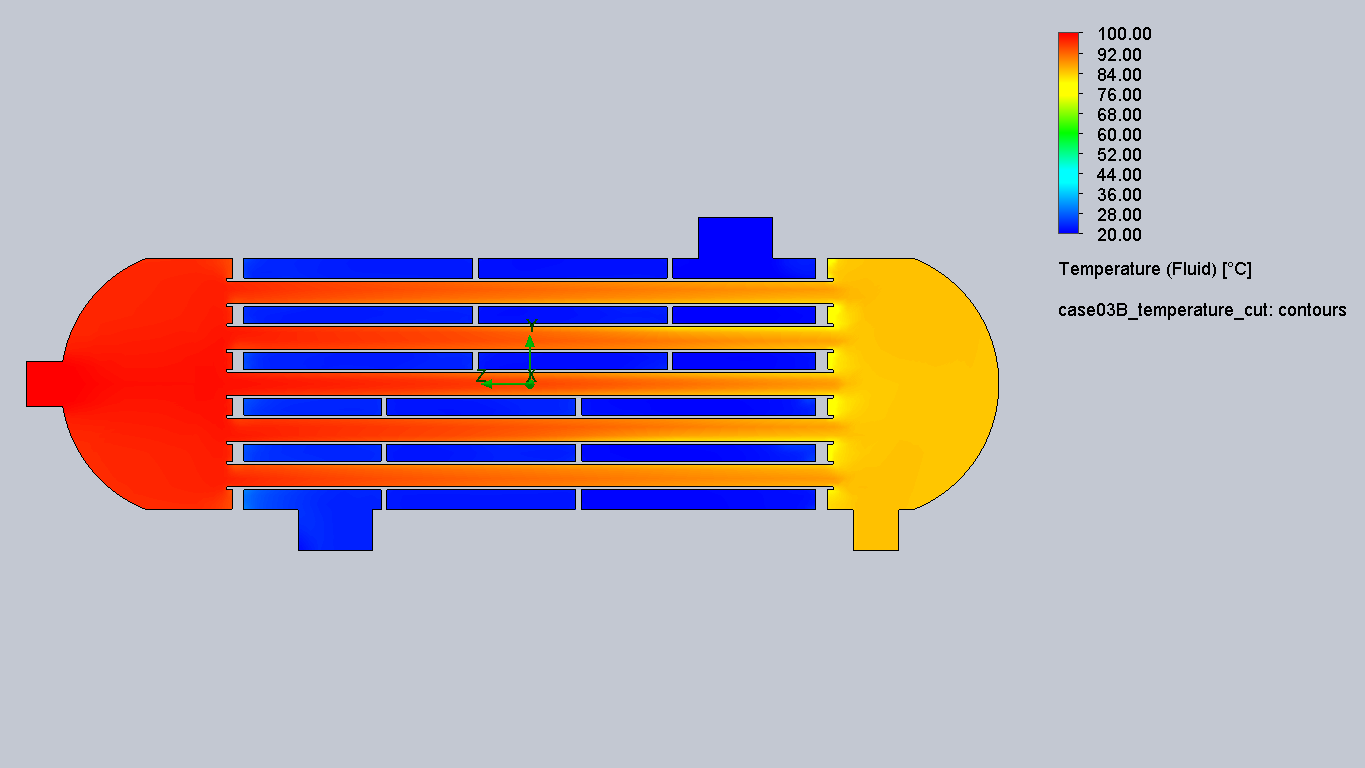
The tube-side inlet path is refined (inline routing) relative to the baseline. Heat transfer rises to 27.2 kW and tube-side Δp falls from 10.69 Pa to 9.82 Pa, making this the preferred option when low pump work and improved duty must be balanced.
Headline metrics: Hot outlet 86.22 °C · Cold outlet 24.96 °C · Heat transfer 27.2 kW · Tube Δp 9.82 Pa · Shell Δp 21.11 Pa · Energy balance 0.01%
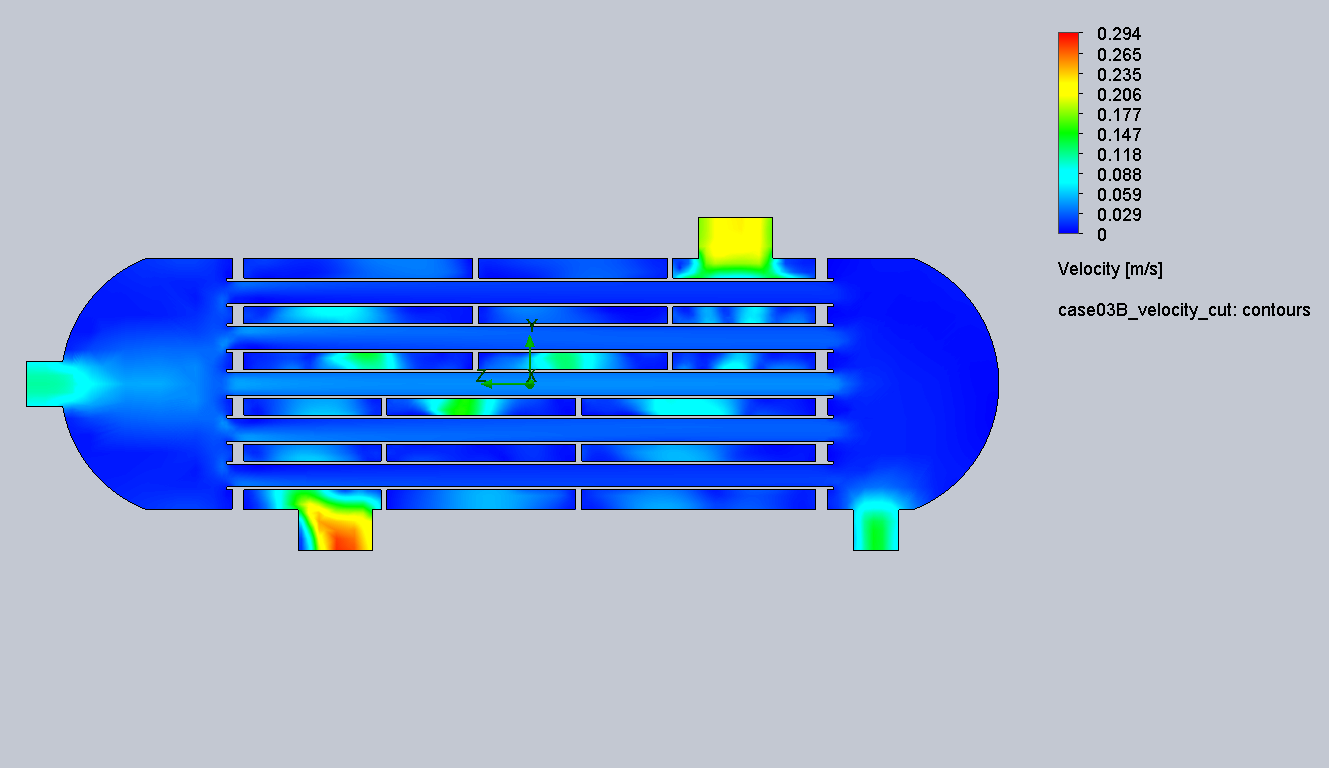
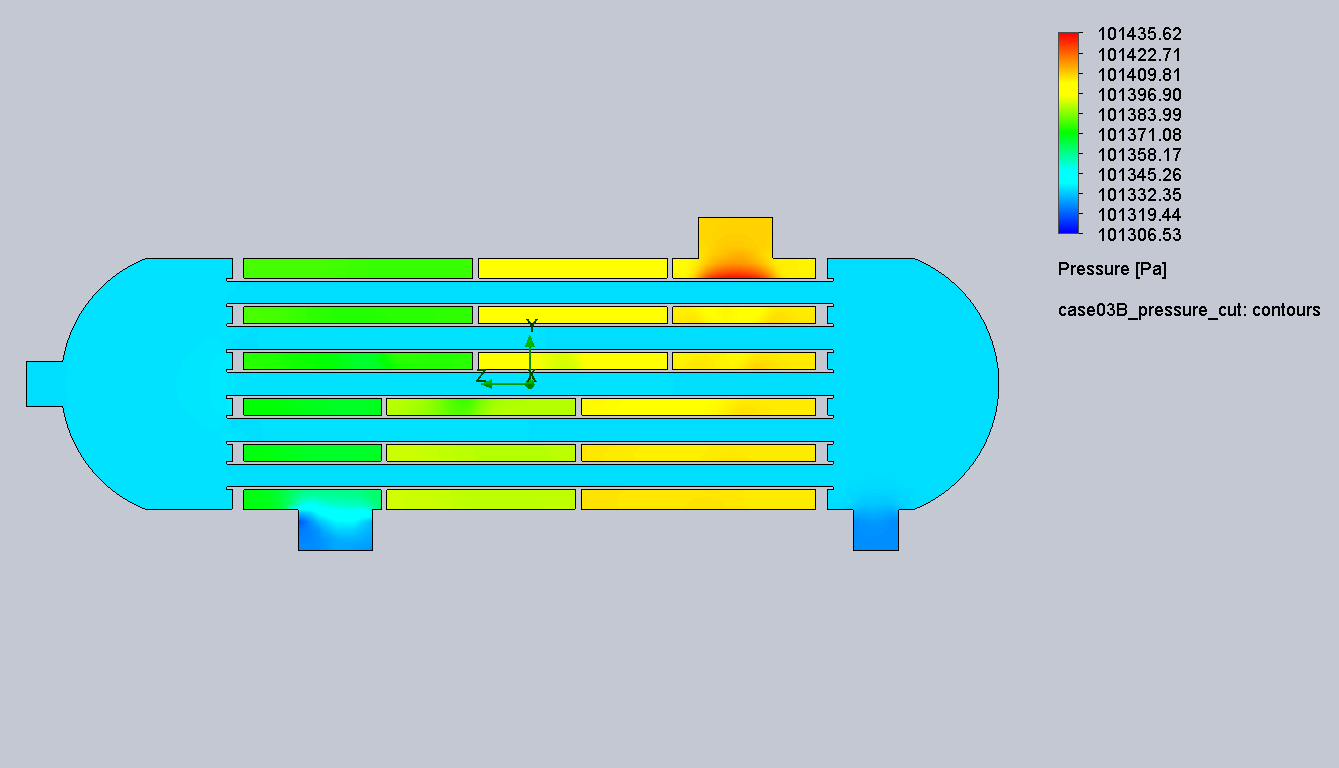
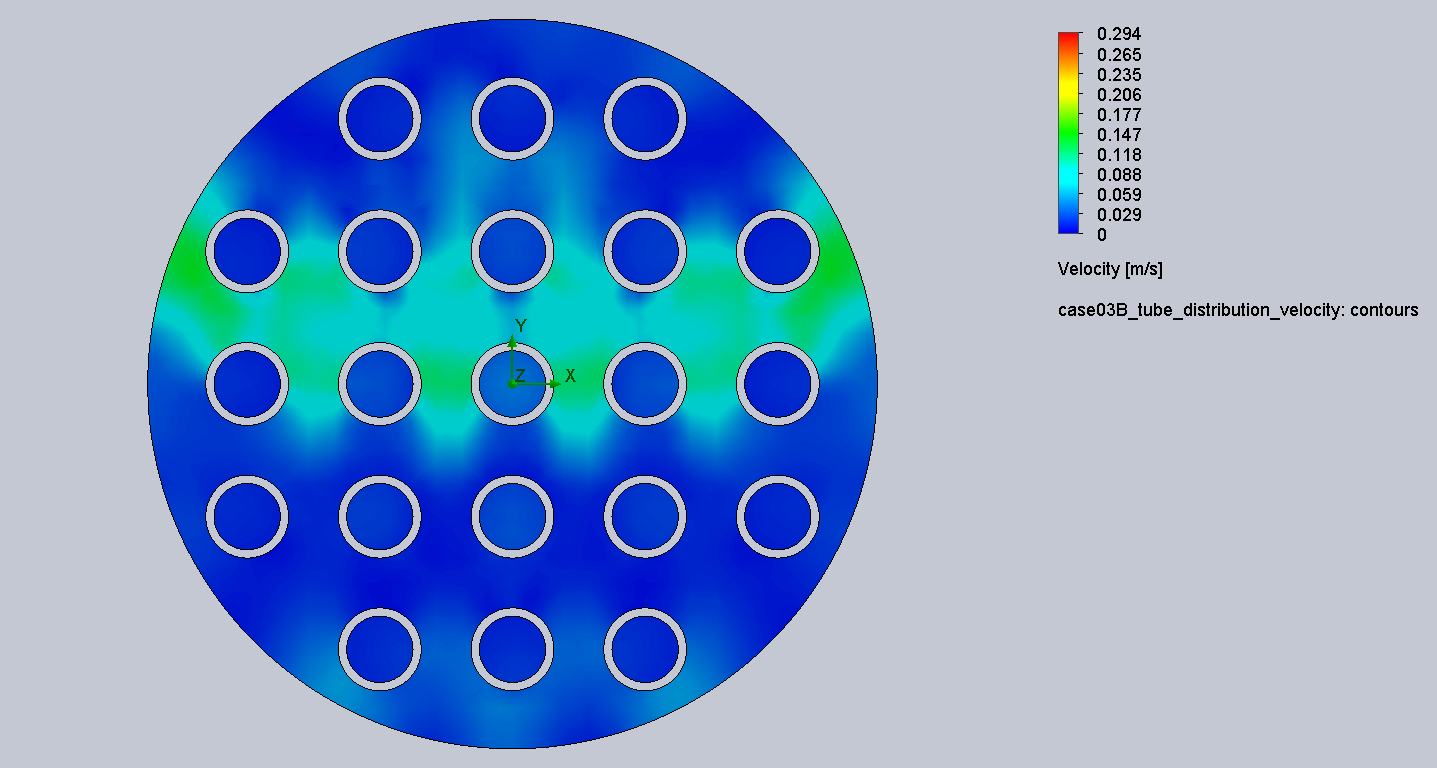
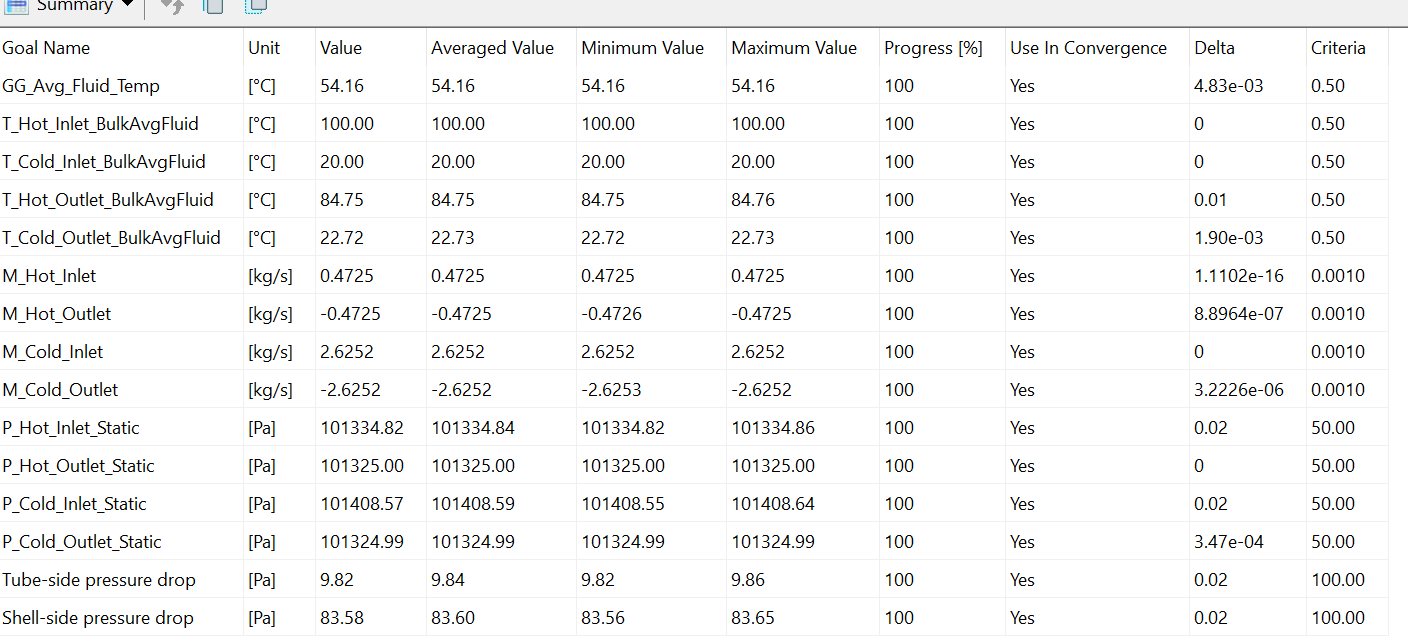
Case 4: Increased Shell-Side Velocity
Case 4 builds on the inline tube-side inlet geometry and doubles shell-side inlet velocity from 0.1 m/s to 0.2 m/s (mass flow on the cold side increases accordingly in the report). Heat transfer reaches ~30.0 kW and the hot outlet drops to 84.75 °C, but shell-side Δp rises to 83.58 Pa, roughly four times the baseline shell-side loss class.
Use this case when maximum duty or lowest hot outlet wins and the pumping budget can absorb the shell-side penalty.
Headline metrics: Hot outlet 84.75 °C · Cold outlet 22.72 °C · Heat transfer 30.0 kW · Tube Δp 9.82 Pa · Shell Δp 83.58 Pa
Takeaways
- Case 1 anchors the study with strong temperature / trajectory visuals and tight energy balance.
- Case 2 shows arrangement sensitivity is limited once baffle-dominated shell-side physics dominates ideal counter vs parallel assumptions.
- Case 3 is the balanced engineering win: more heat transfer than baseline with lower tube Δp.
- Case 4 is the performance extreme: highest duty and coolest hot outlet, with shell Δp as the controlling penalty.
Further optimisation paths (beyond this study)
This project varied flow arrangement, tube-side inlet routing, and shell-side inlet velocity with a fixed bundle and baffle layout. In industrial shell-and-tube design, several additional levers are commonly explored, often with CFD or semi-empirical methods together.
Shell-side hydraulics and baffles. Segmental baffles dominate many designs; baffle spacing and baffle cut (fraction of shell chord removed) strongly influence cross-flow velocity, recirculation zones, and window pressure drop. Alternative concepts such as double segmental, helical, or rod / grid baffles change the balance between mixing, bypass streams, and Δp. Literature and design practice consistently treat these parameters as primary knobs when shell-side resistance or maldistribution limits performance.
Tube field geometry. Tube pitch (triangular vs square), tube count, tube length, and inner / outer diameter set area, velocity in each pass, and metal inventory. Changing pitch or tube layout alters both sides’ coefficients and pressure drop; optimisation is usually multi-objective (duty, Δp, footprint, cost).
Passes and nozzles. Multi-pass tube arrangements (increasing tube-side passes) change velocity and LMTD effectiveness at fixed shell geometry. Nozzle sizing, impingement plates, and seal strip / bypass-seal features address erosion and bypass flow that simple velocity cuts do not fully isolate.
Enhanced heat transfer. Low-fin tubes, internal enhancements, or tube inserts (for example twisted-tape style inserts) raise inner-side heat transfer coefficient at the expense of tube Δp; suitability depends on fouling and maintenance constraints.
Operating and lifecycle constraints. Fouling resistance in design margins, material upgrades for corrosion, and total pumping power (both streams) belong in the objective function alongside peak kW or outlet temperature. Some studies combine CFD with design-of-experiments or surrogate optimisation to sweep baffle and bundle parameters efficiently.
Together, these directions extend the same question asked here: which change buys thermal performance, which buys pressure drop, and what combination meets installed cost and operability for the real application.