Project Detail
CHT Analysis: GPU Thermal Management
A conjugate heat transfer (CHT) study on a graphics card using ANSYS Fluent. Two simulation cases were built, a coarse global mesh and a refined inner-enclosure mesh, to study temperature distribution, hotspot regions, recirculation zones, and wall heat flux across the PCB, processor, and aluminium fin stack.
What is Conjugate Heat Transfer?
Conjugate Heat Transfer (CHT) analysis is used when a computational domain contains multiple co-existing heat transfer modes, typically solid conduction and fluid convection, and the coupling at the solid-fluid interface must be resolved simultaneously.
For electronic cooling problems like a GPU, CHT is the correct approach because:
- Heat is generated inside the silicon processor and conducted through the heatsink fins (solid domain)
- That heat is then removed by forced convection from moving air (fluid domain)
- The two domains are tightly coupled, the temperature at the fin surface depends on both the conduction path through the solid and the local air velocity
Standard CFD (fluid-only) or FEA (solid-only) would miss this coupling. CHT captures both and resolves the interface accurately.
Physical Setup
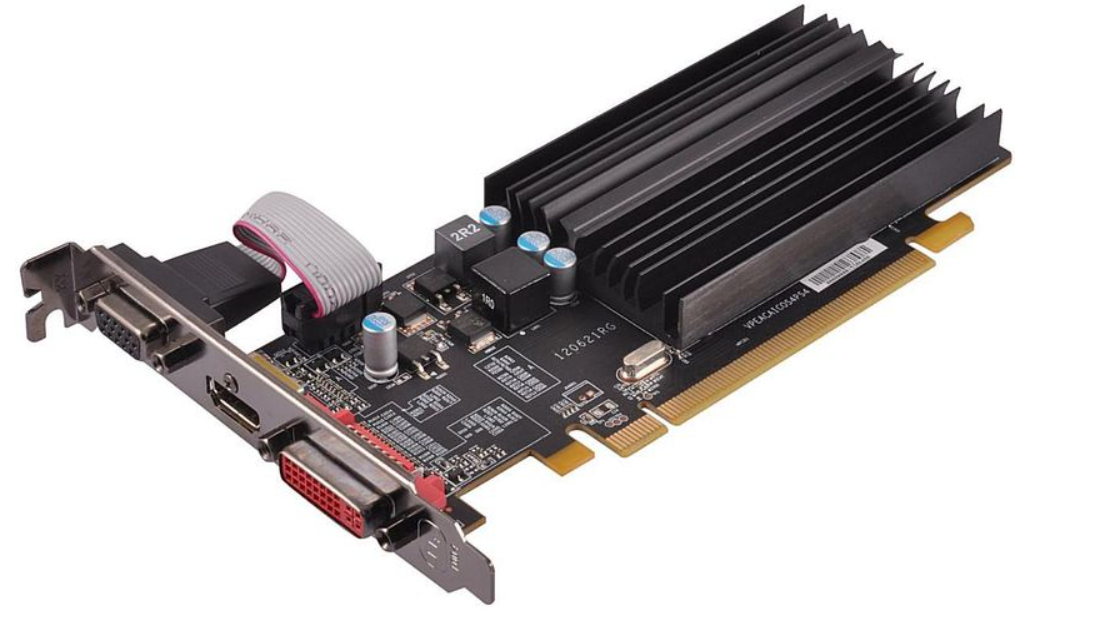
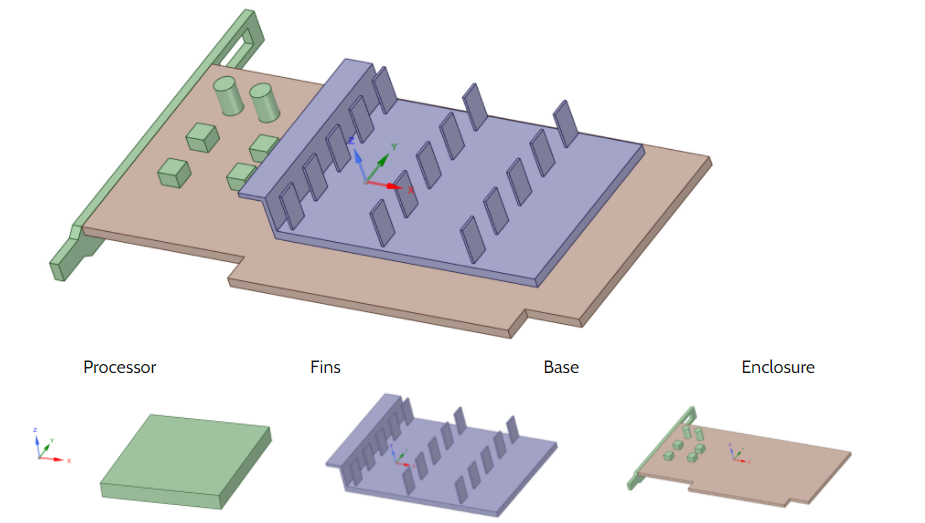
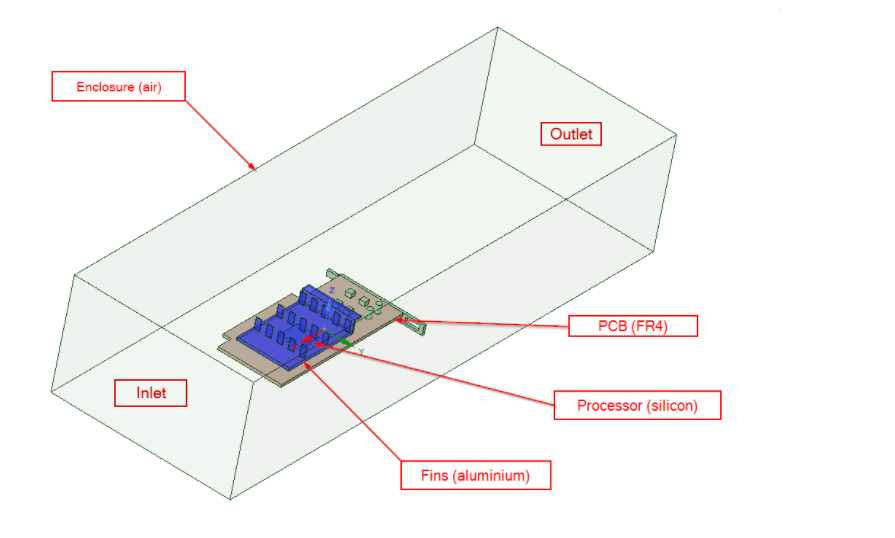
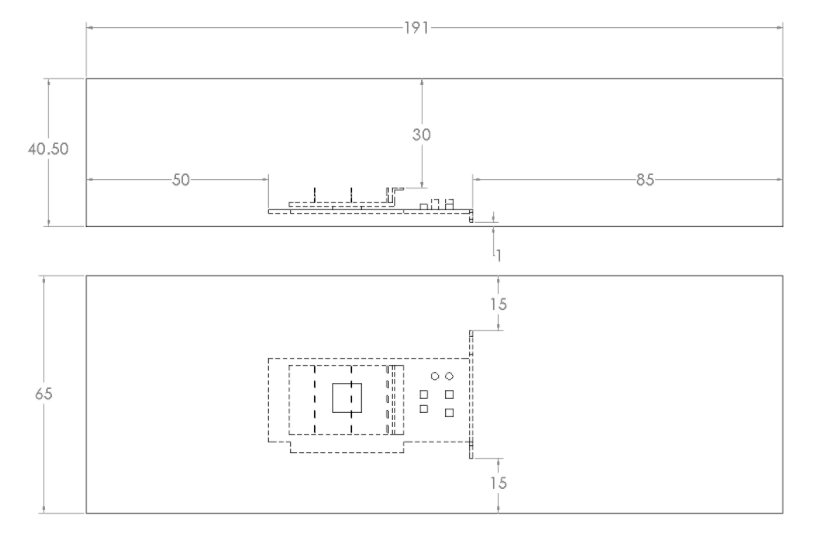
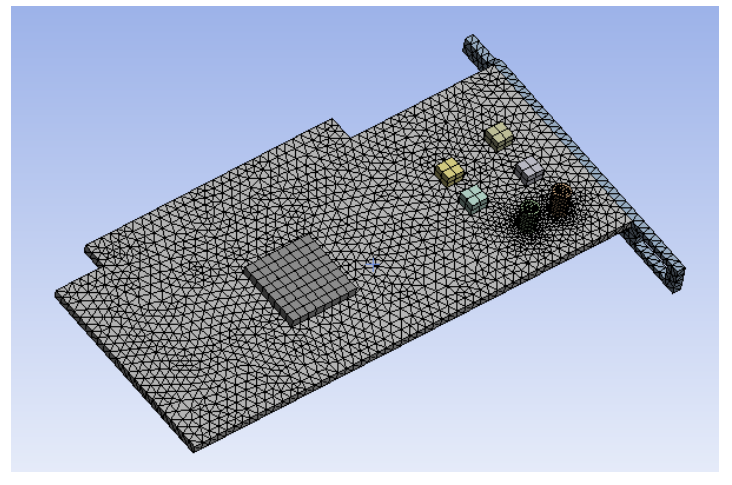
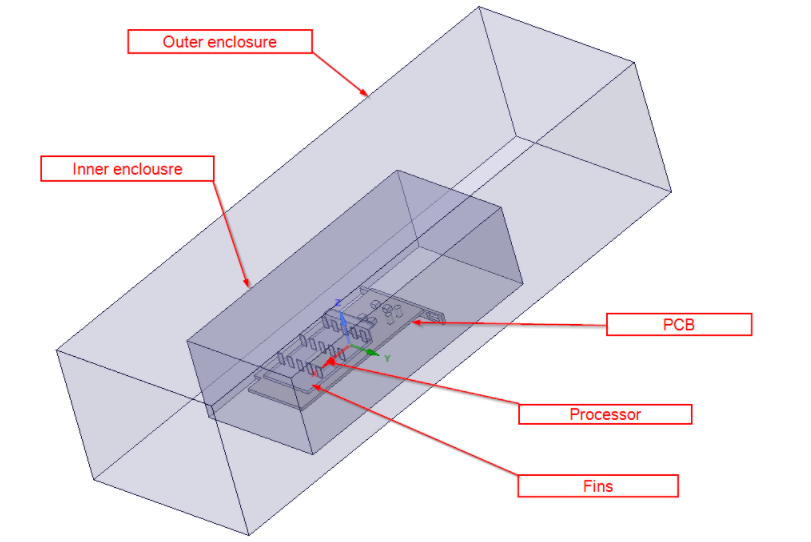
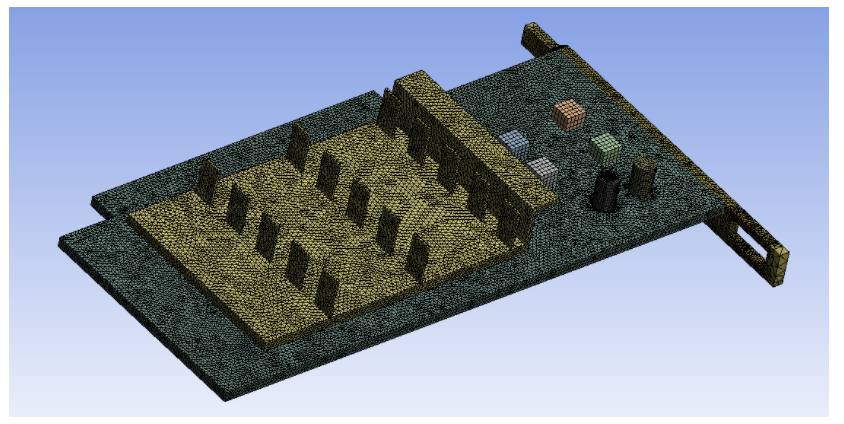
The GPU was simplified into four solid bodies with distinct material properties, placed inside an air-filled enclosure that defines the flow domain.
Boundary Conditions & Input Parameters
| Parameter | Value | Basis |
|---|---|---|
| Inlet air velocity | 2 m/s | Experimental fan study (Ref 1), maximum recorded fan outlet velocity |
| GPU power draw | 75 W | Typical 2 GB entry-level GPU thermal design power (Ref 2) |
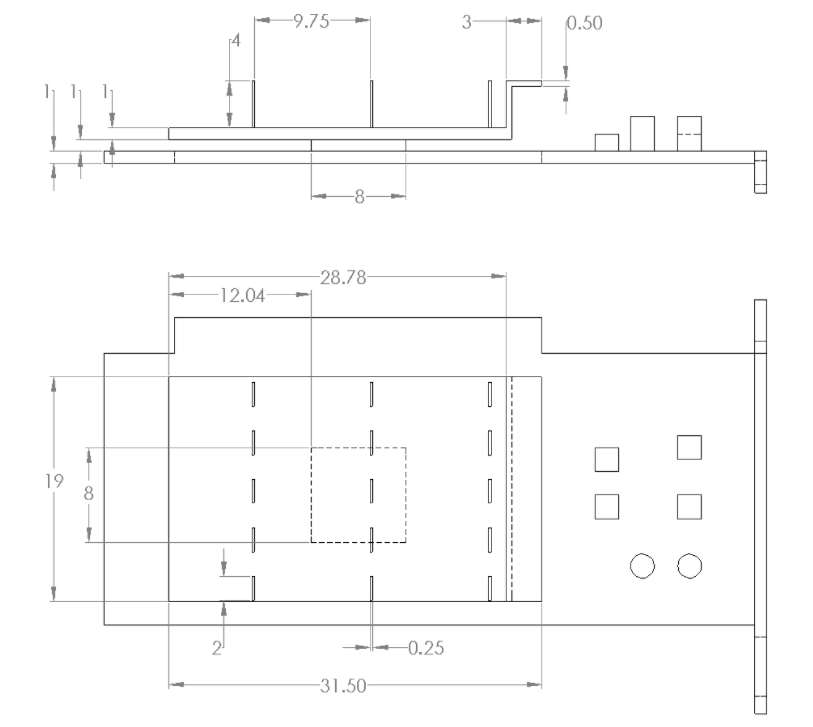
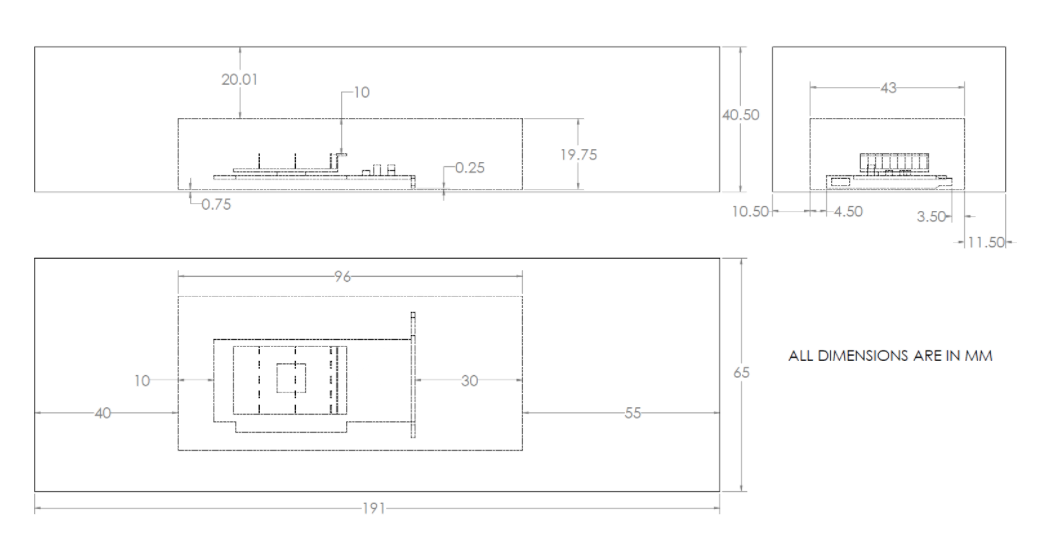
| Processor volume | 40 × 40 × 2 mm | Standard GPU die footprint |
| Heat generation rate (Q) | 2.3437 × 10⁷ W/m³ | Q = P/V = 75 / (0.04 × 0.04 × 0.002) |
| Solver type | Steady-state, pressure-based | , |
| Turbulence model | Realizable k-ε | Appropriate for separated flows and recirculation near bluff bodies |
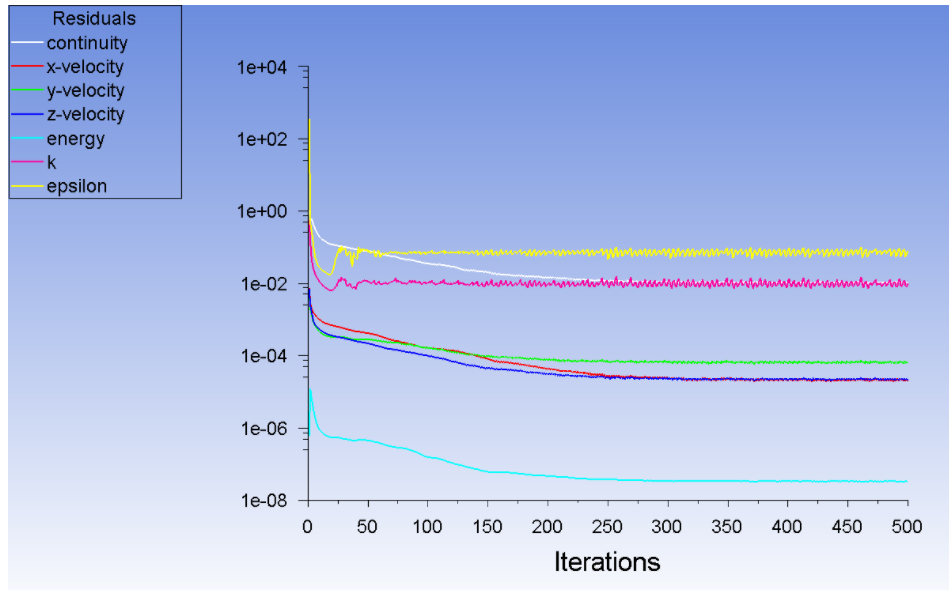
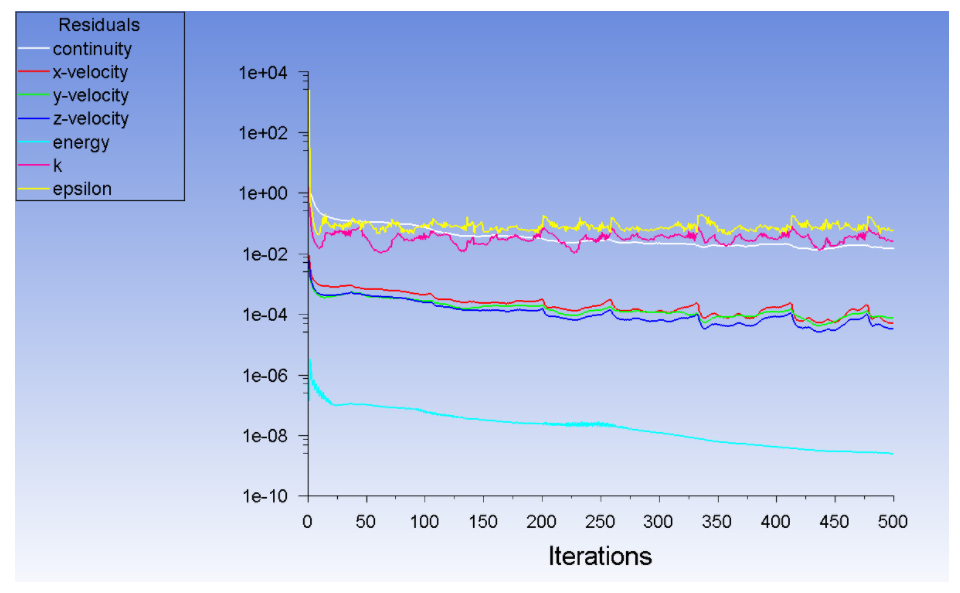
| Iterations | 500 | Convergence monitored via residuals |
Heat generation assumption: 99.9% of GPU electrical power is assumed to convert to heat (Ref 2). The heat source is applied as a volumetric heat generation on the processor body only.
Material Properties
| Material | Component | Density (kg/m³) | Heat Capacity (J/kg·K) | Thermal Conductivity (W/m·K) |
|---|---|---|---|---|
| Aluminium | Fins | 2719 | 871 | 204.4 |
| Silicon | Processor (GPU die) | 2000 | 710 | 150 |
| FR4 (glass-epoxy laminate) | PCB | 1850 | 950 | 0.29 |
| Air | Fluid domain | 1.225 | 1006.43 | 0.0242 |
FR4 has extremely low thermal conductivity (0.29 W/m·K) compared to the aluminium fins (204.4 W/m·K), a 700× difference. This makes the PCB a thermal barrier rather than a heat spreader, confirming that the fin stack is the critical cooling path.
Case 1, Coarse Global Mesh (10 mm)
Geometry
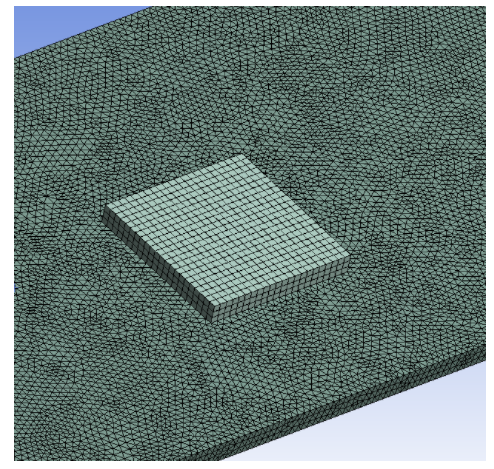
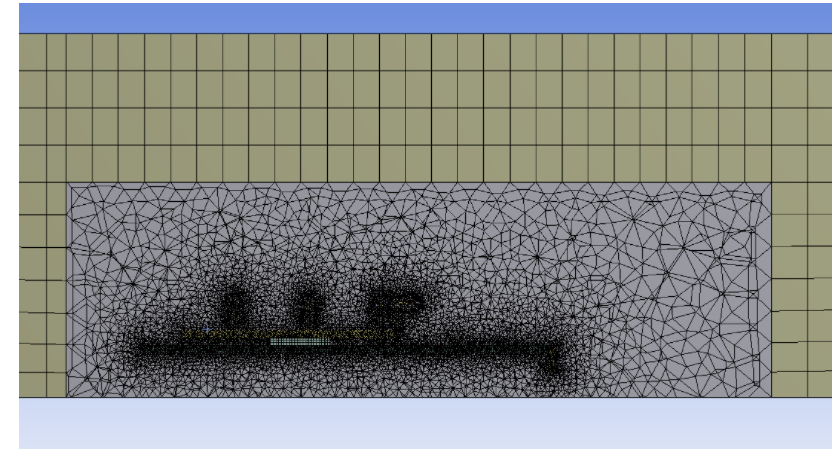
Mesh Settings
| Zone | Method | Element Size |
|---|---|---|
| Global | Automatic | 10 mm |
| PCB body | Body sizing | 1 mm |
| Processor body | Body sizing | 1 mm |
| Fins body | Body sizing | 1 mm |
Total mesh elements: 201,920
Results
Residual Convergence
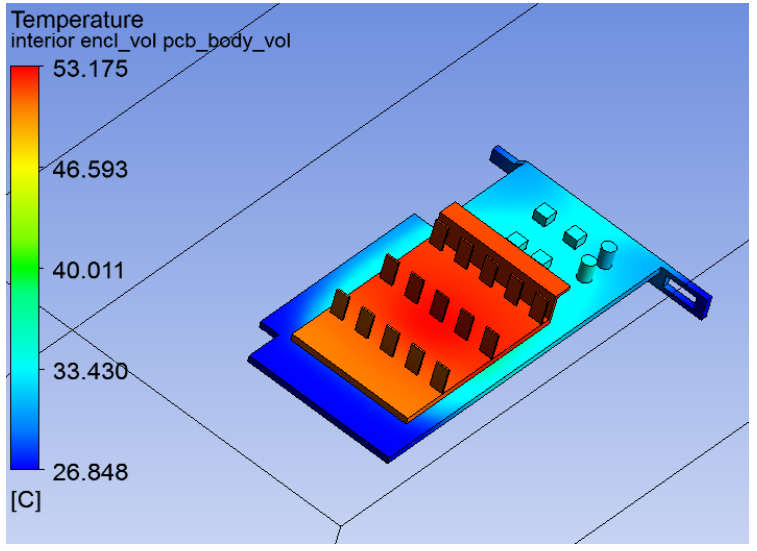
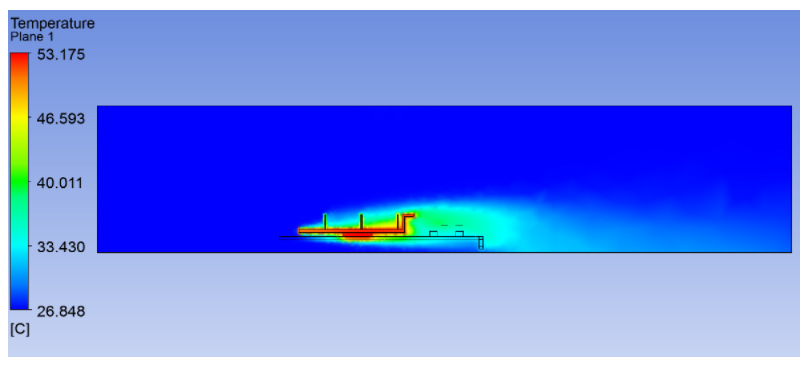
Temperature Distribution
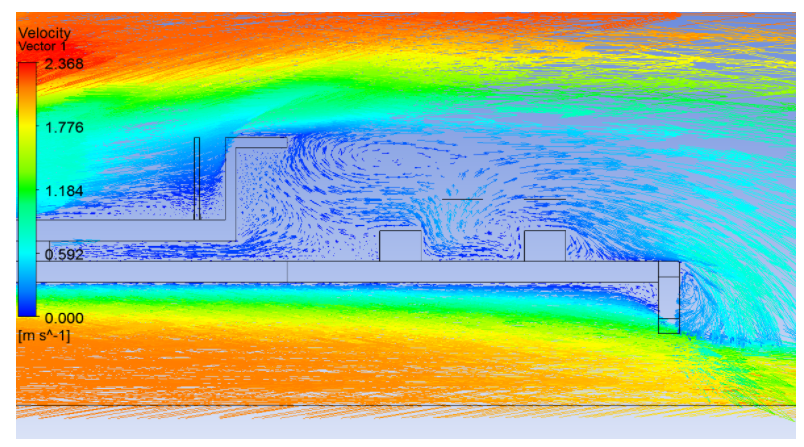
Velocity & Flow Structure
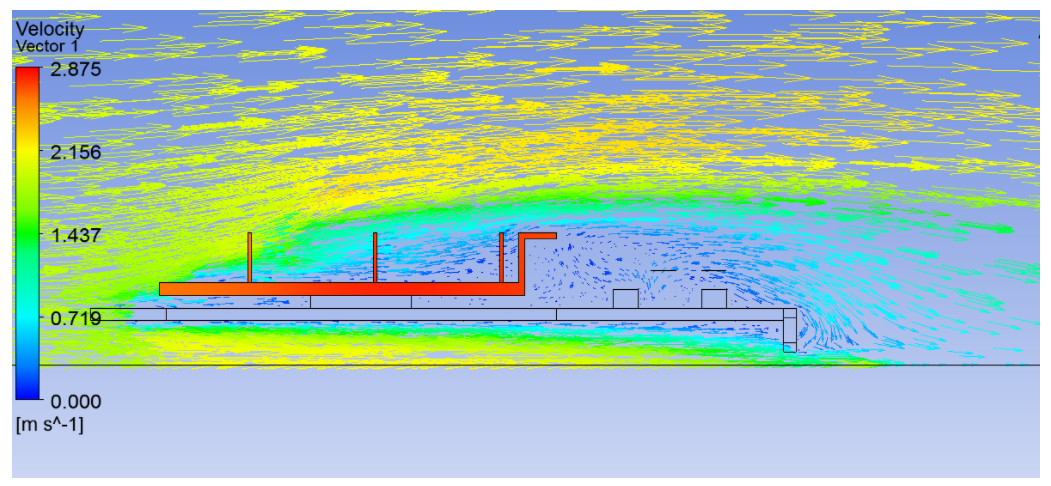
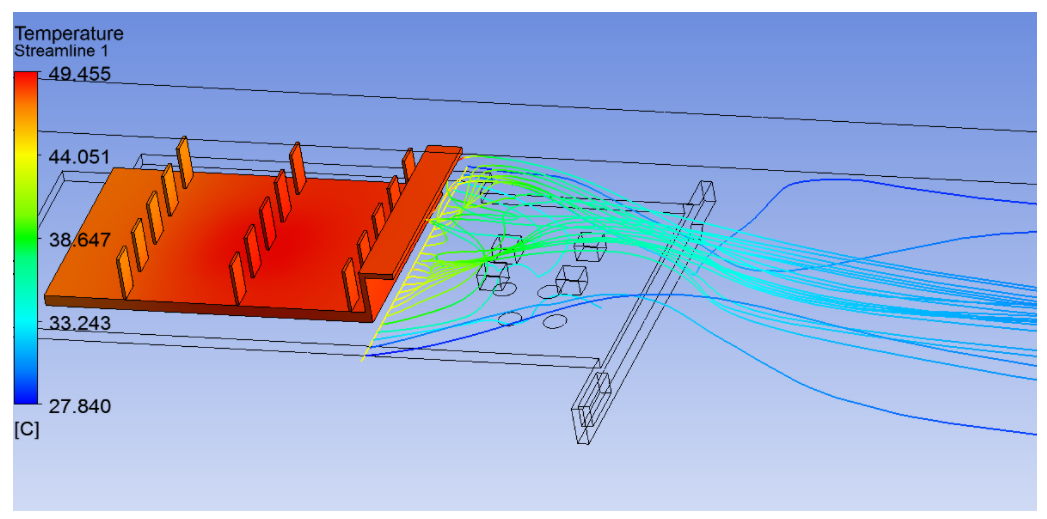
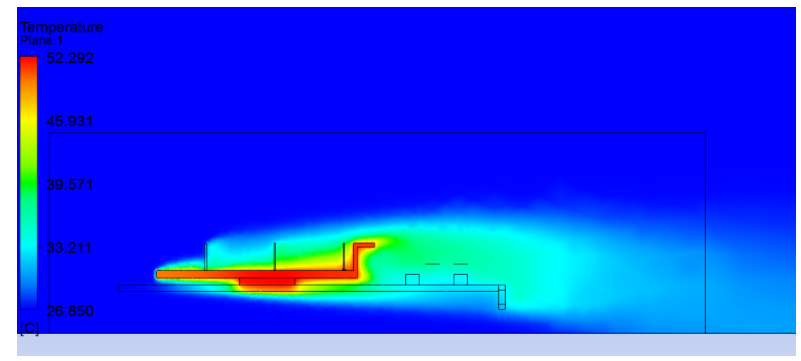
Design Insight: The warm (~38°C) stagnant air behind the fin trailing edge is dangerous for downstream components. Any heat-generating component placed there will not cool efficiently due to reduced temperature differential between air and component. Components without heat generation will also gradually warm up due to the trapped hot air. The processor should be positioned upstream of these recirculation zones.
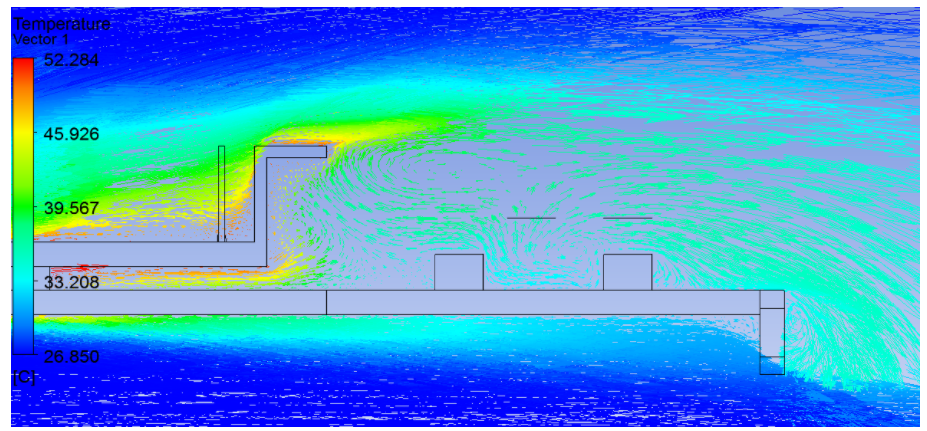
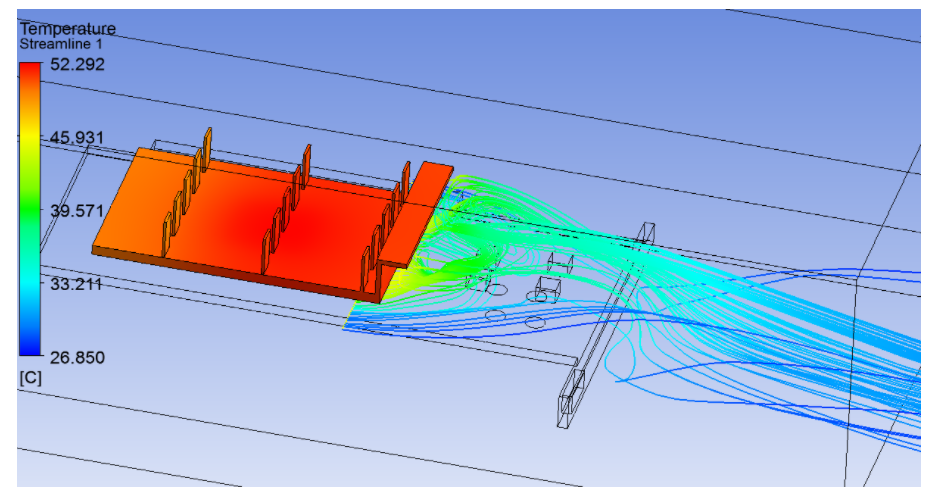
Temperature Streamlines & Heat Flux
Case 2, Refined Mesh with Inner Enclosure
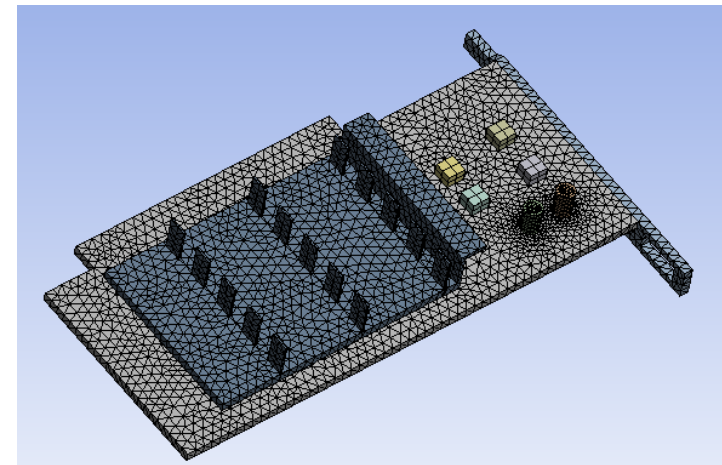
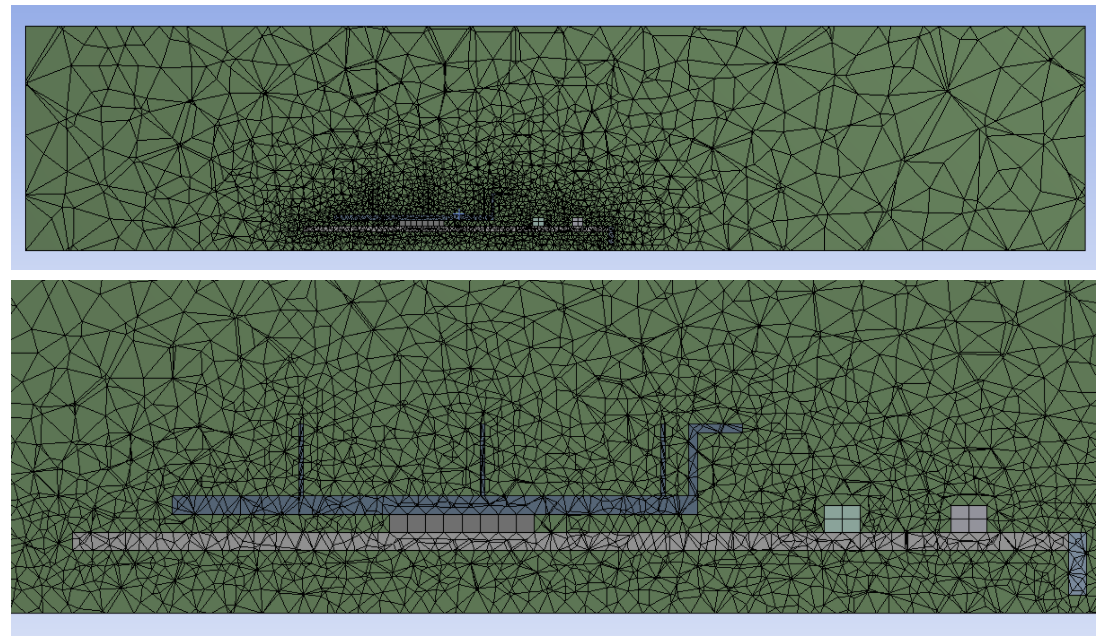
The coarse global mesh in Case 1 uses 201,920 elements but cannot resolve thin boundary layers or the fine geometric features between fins accurately. Case 2 introduces a conformal inner enclosure tightly surrounding the GPU, enabling a much finer mesh in the thermally active region while keeping the outer domain coarser.
Geometry
Mesh Settings
| Zone | Method | Element Size | Notes |
|---|---|---|---|
| Global | Automatic | 5 mm | Halved from Case 1 |
| Outer enclosure | Body sizing | , | Proximity capture: Yes (0.1 mm) |
| Inner enclosure | Body sizing | 0.4 mm | Curvature capture: Yes |
| Fins | Body sizing | 0.4 mm | Hard behaviour, no curvature/proximity |
| Processor | Body sizing | 0.4 mm | Hard behaviour |
| PCB | Body sizing | 2 mm | Curvature capture: Yes |
| Multizone | Outer enclosure | , | For structured hex layers |
Total mesh elements: 422,289
Results
Residual Convergence
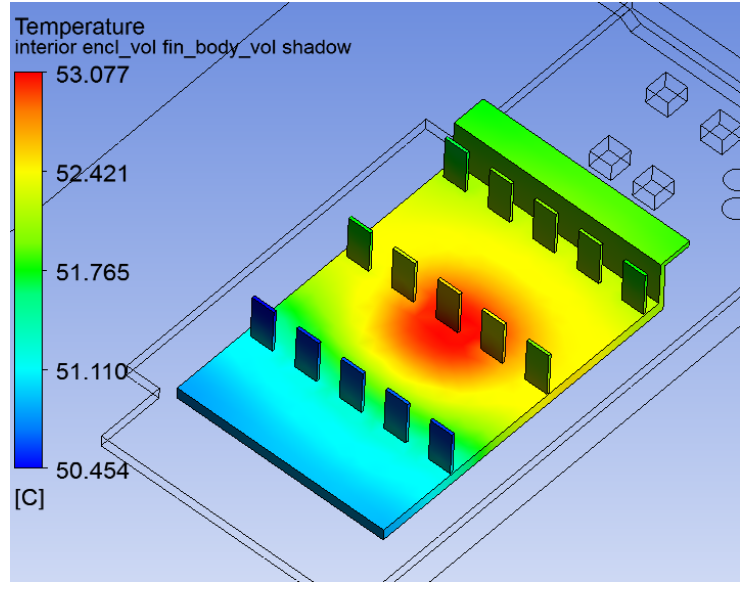
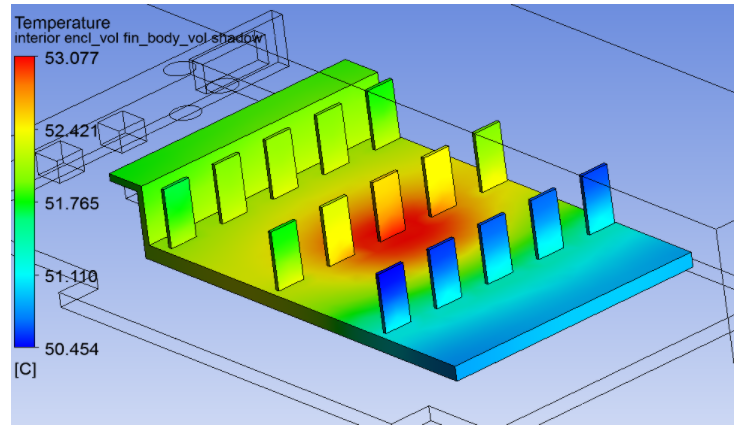
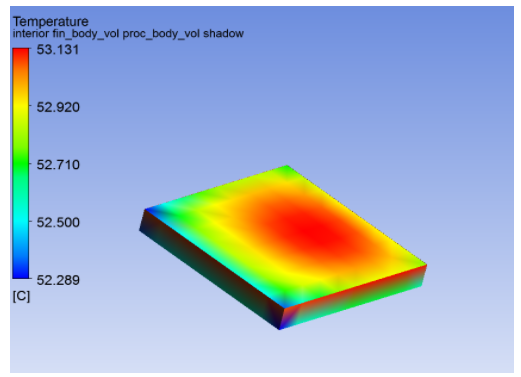
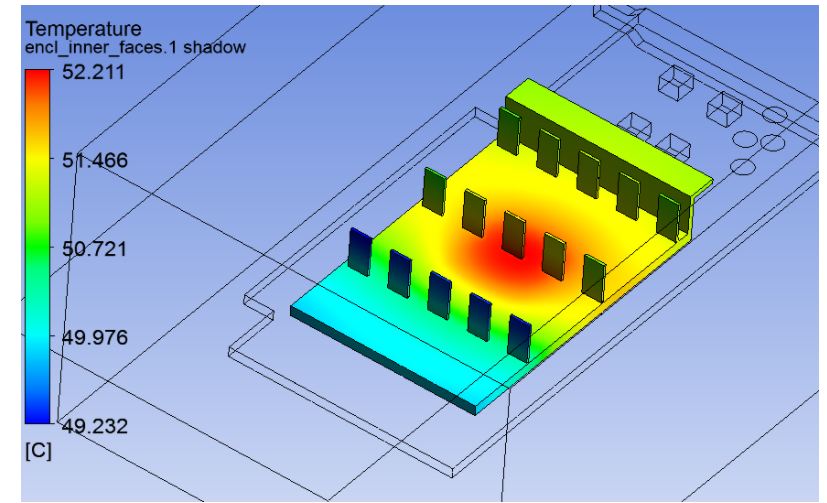
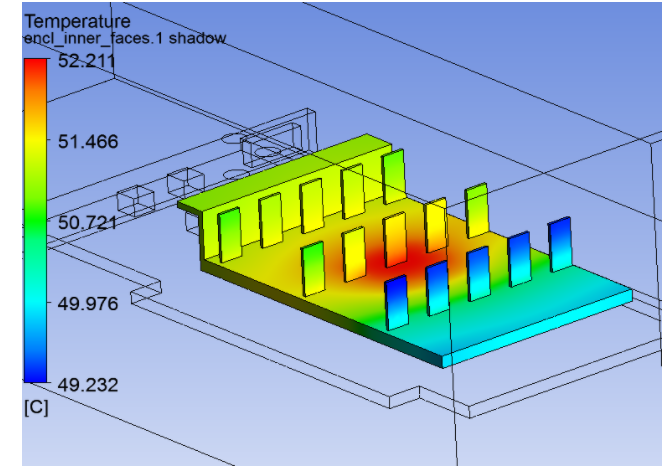
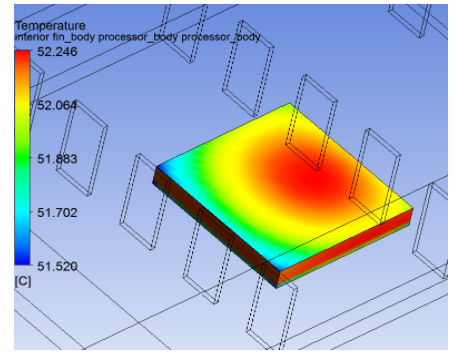
Temperature Distribution
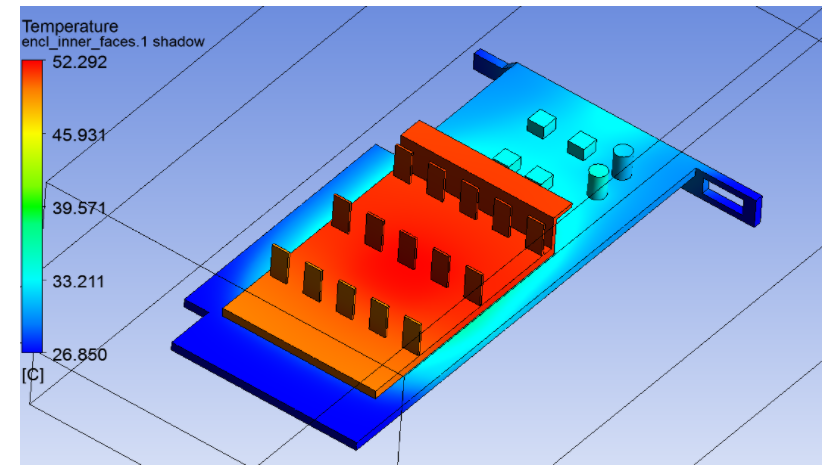
Velocity & Flow Structure
Temperature Streamlines & Heat Flux
Comparative Analysis
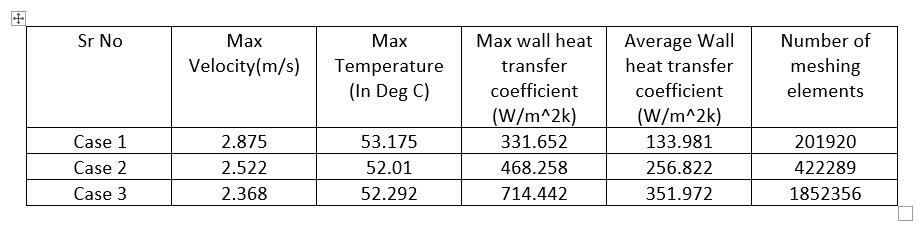
| Metric | Case 1 (10 mm global) | Case 2 (5 mm + inner zone) | Case 3 (reference) |
|---|---|---|---|
| Max velocity (m/s) | 2.875 | 2.522 | 2.368 |
| Max temperature (°C) | 53.175 | 52.01 | 52.292 |
| Max wall HTC (W/m²·K) | 331.652 | 468.258 | 714.442 |
| Avg wall HTC (W/m²·K) | 133.981 | 256.822 | 351.972 |
| Mesh elements | 201,920 | 422,289 | 1,852,356 |
Key observations:
- Temperature is relatively insensitive to mesh refinement (< 1.2°C variation), the bulk energy balance is captured even on coarse meshes
- Wall heat transfer coefficient is highly mesh-sensitive, avg HTC nearly doubles from Case 1 to Case 2. This is because HTC depends on local velocity gradients at the wall, which are only resolved correctly with fine near-wall cells
- Max velocity decreases with refinement, coarser meshes overpredict peak velocities because they smear boundary layers into adjacent cells
- Mesh independence has not been fully achieved by Case 2, Case 3’s further ~4× element count shows HTC is still climbing. A wall y⁺ study would be needed for a production-grade result
Key Engineering Insights
-
Recirculation zones set component placement rules. The warm (38°C), low-velocity (~0.3 m/s) dead zone behind the fin trailing edge means any heat-generating component placed there will thermally self-destruct over time. The processor must sit upstream.
-
FR4 PCB is a thermal bottleneck. At 0.29 W/m·K, the PCB conducts heat ~700× less effectively than the aluminium fins. Conduction through the board is negligible, all meaningful heat must exit through the fin stack. This is why the fin-to-processor interface thermal resistance is the dominant term.
-
Boundary layer resolution drives HTC accuracy. The 91% increase in average HTC from Case 1 to Case 2 is not a physical change, it reflects the coarse mesh’s inability to resolve the sharp velocity gradient at the wall. For thermal management decisions, always validate with a mesh sensitivity study.
-
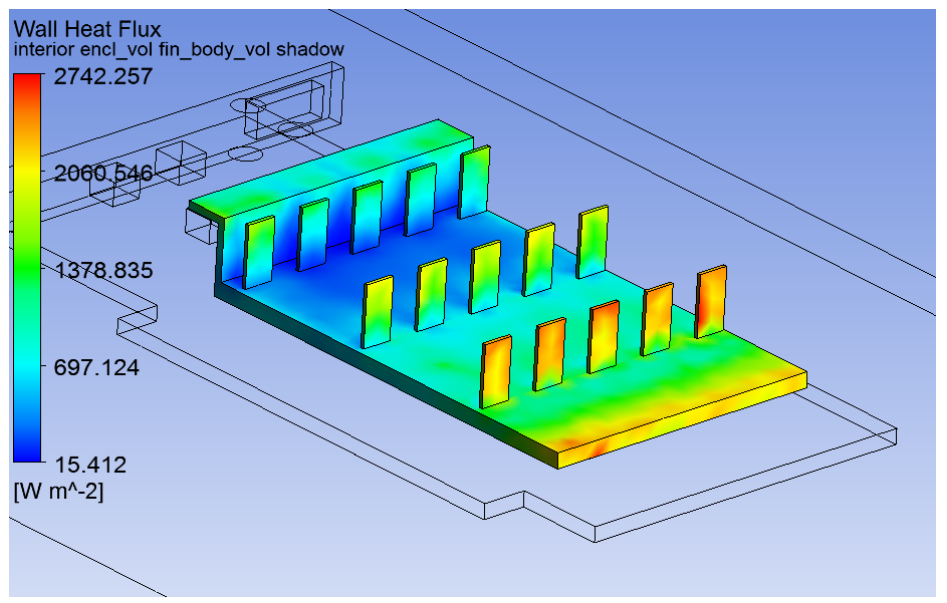
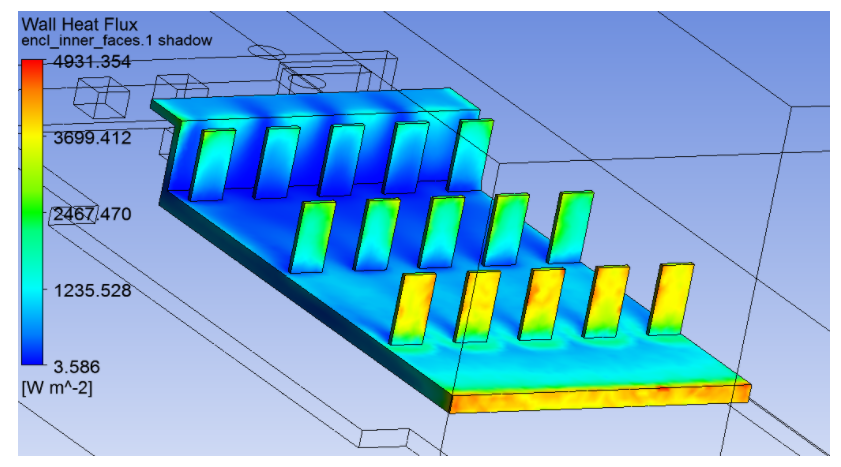
Fin leading edge is the highest flux zone. Wall heat flux peaks at the upstream fin faces and decays downstream as the air temperature rises. Fin optimisation (variable pitch, tapered profile) should prioritise the leading edge section.
References
- Fan outlet velocity distributions, academia.edu, 25 mm fan max outlet velocity: 2 m/s
- GPU power-to-heat conversion, electronics.stackexchange.com, 99.999% of electrical power converted to heat
- Computing hardware materials, engineering.com
- FR4 material properties, mgc.co.jp