Project Detail
Catalytic Converter: Flow Optimisation Study
A six-case SolidWorks Flow Simulation study on internal flow distribution through a catalytic converter. Starting from a baseline geometry with significant maldistribution, the study evaluates baffle and guided vane concepts to simultaneously improve catalyst inlet uniformity and reduce total pressure drop.
What Is This Study About?
A catalytic converter works by passing exhaust gas through porous catalyst blocks where chemical reactions neutralise pollutants. The efficiency of those reactions depends on how evenly the flow is distributed across the catalyst face, a concentrated jet hitting one region and starving another means uneven catalyst loading, faster localised degradation, and reduced conversion efficiency.
This study uses SolidWorks Flow Simulation to evaluate six design configurations, starting from a bare baseline and progressively refining a guided vane geometry, to find the configuration that simultaneously produces the most uniform catalyst inlet flow and the lowest total pressure drop.
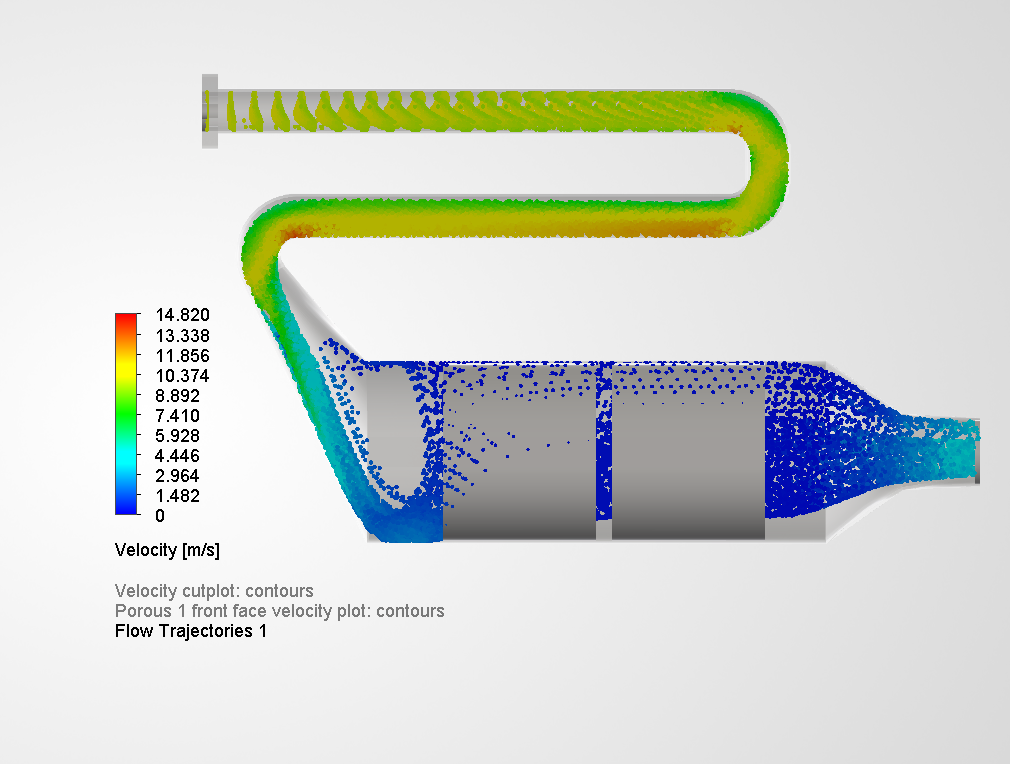
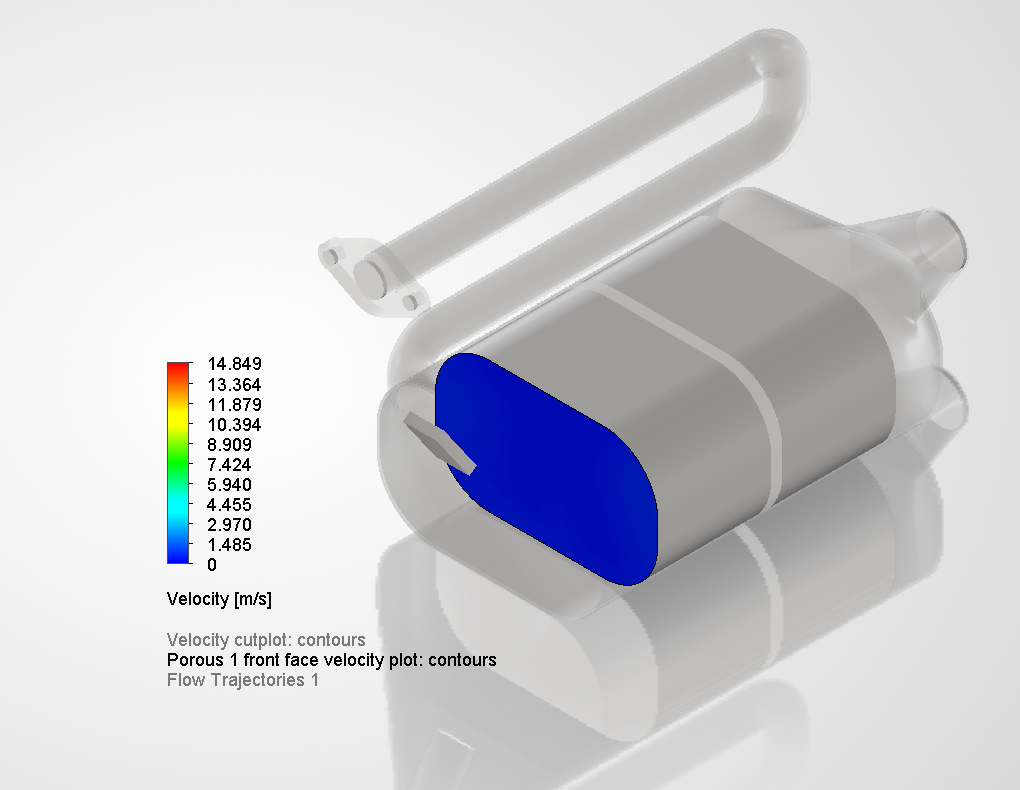
Two porous media blocks represent the catalyst sections. The study uses cold-flow air at a fixed 10 m/s inlet velocity so that all cases are directly comparable.
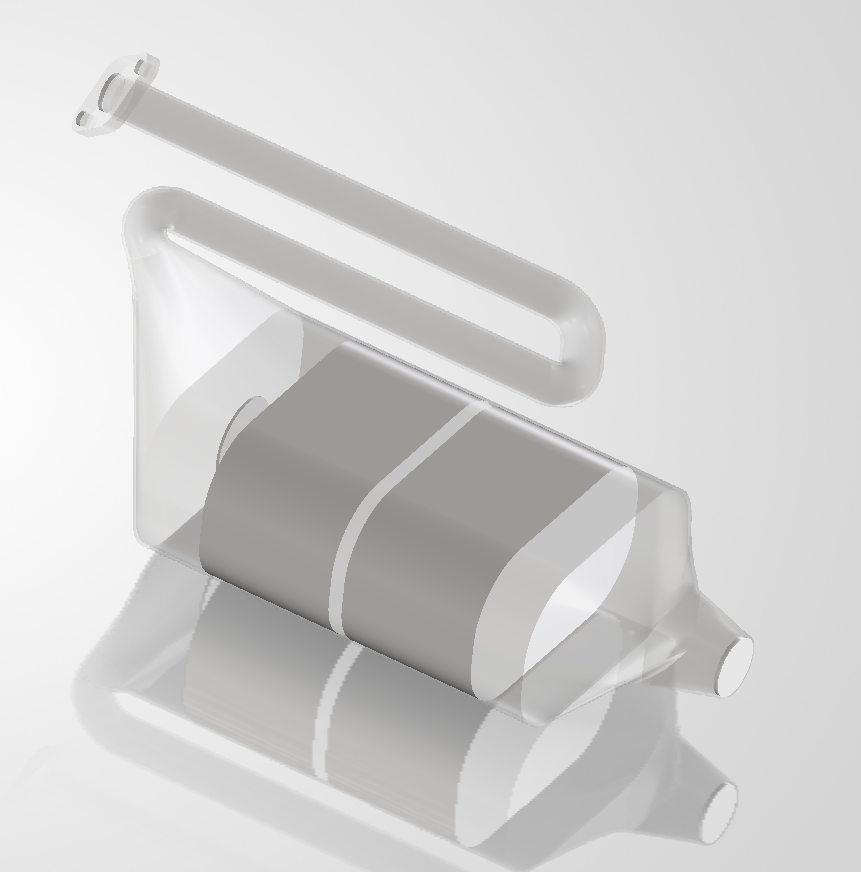
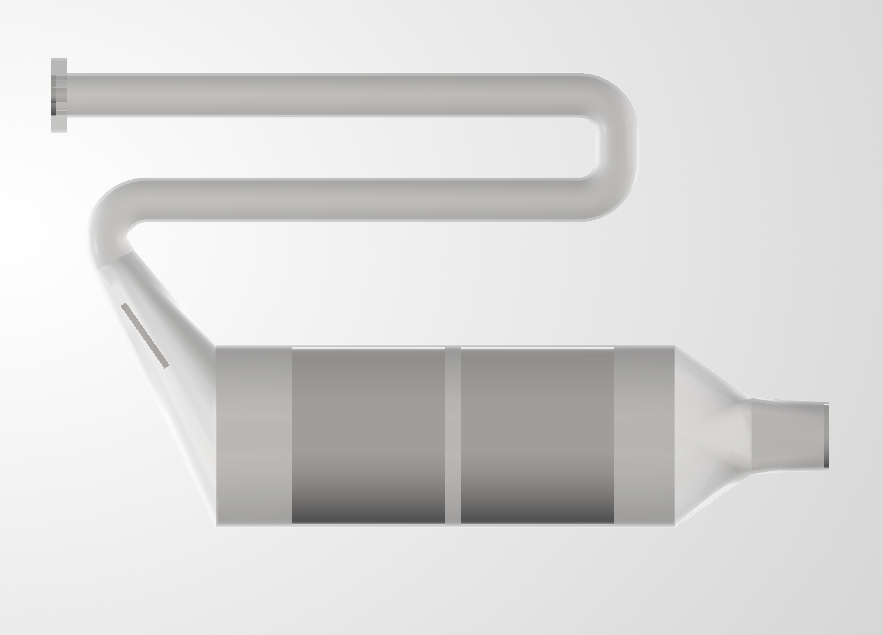
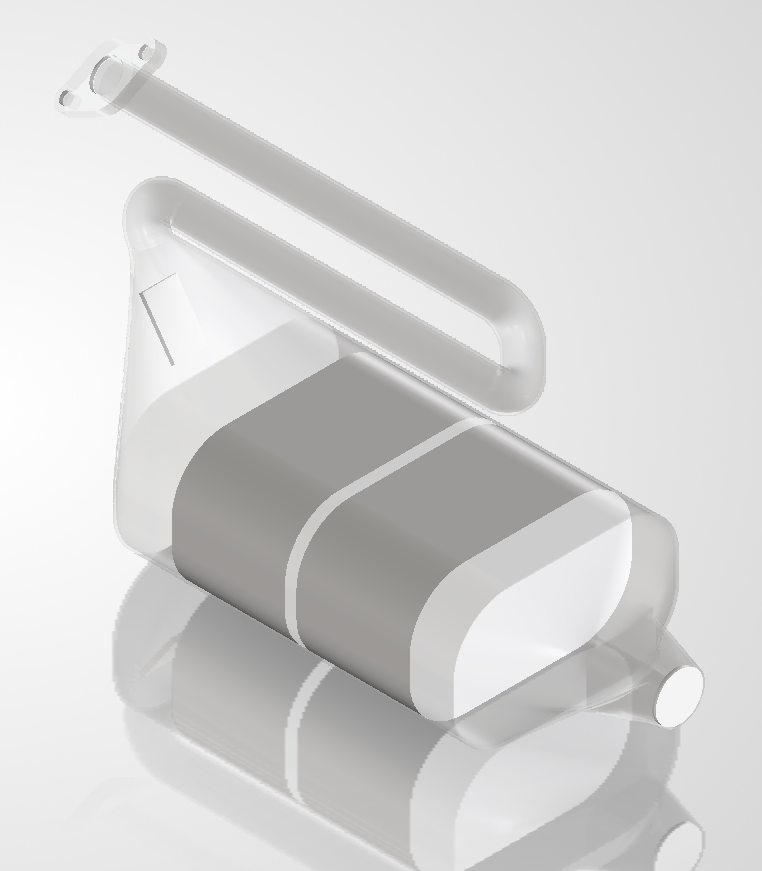
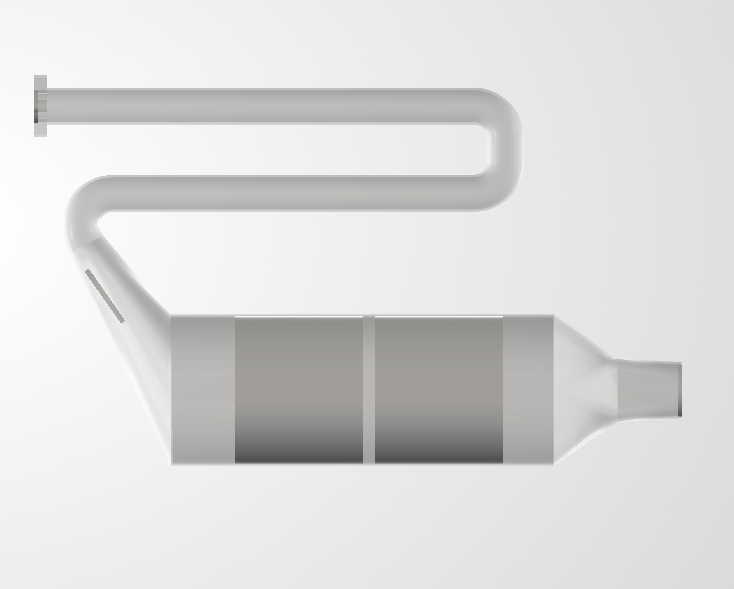
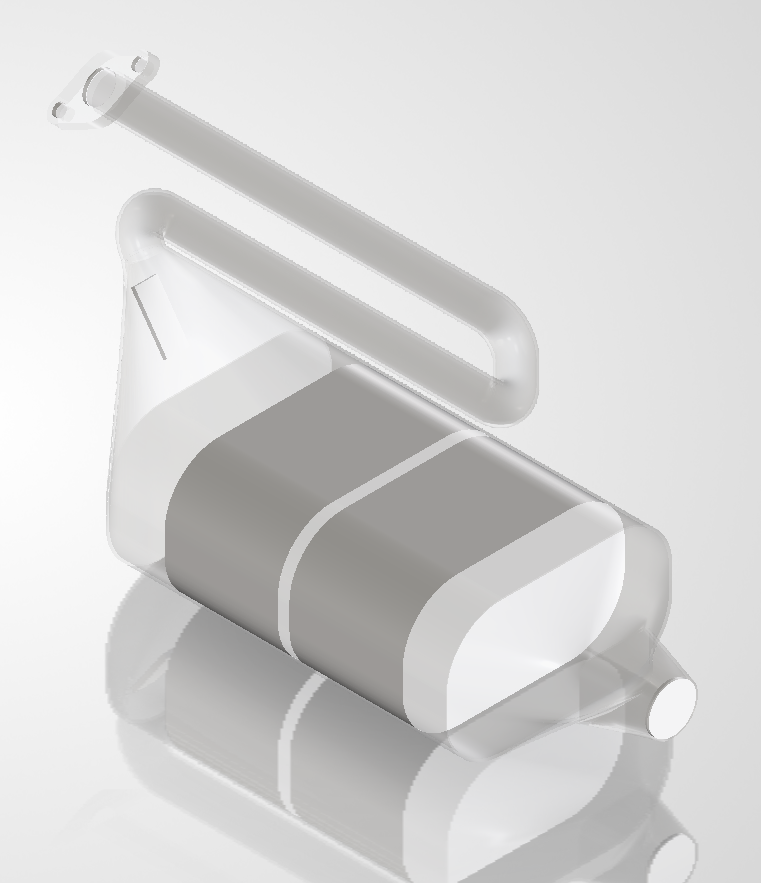
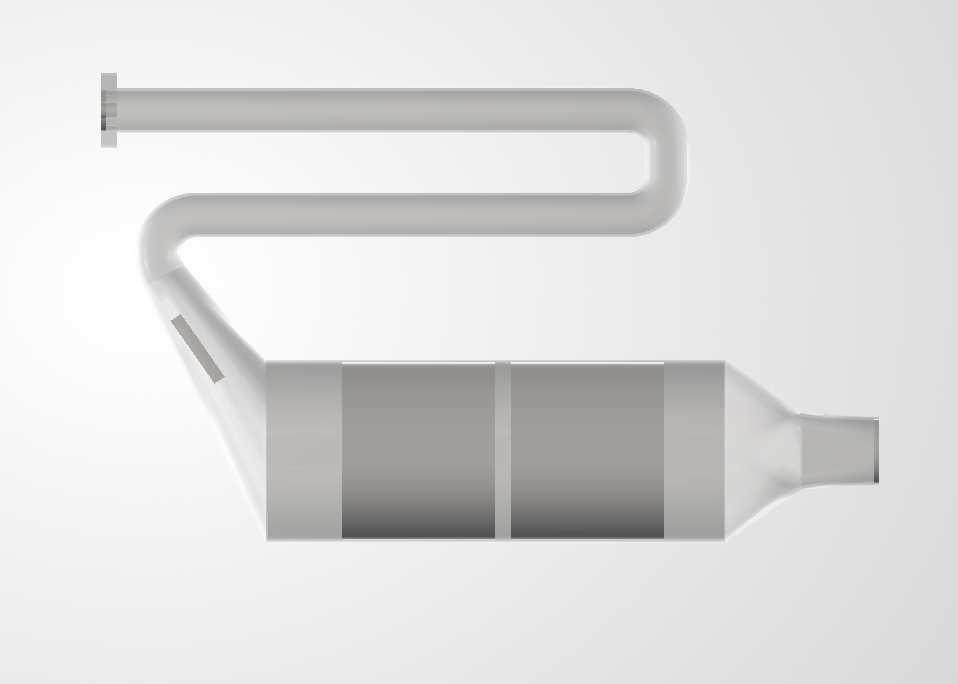
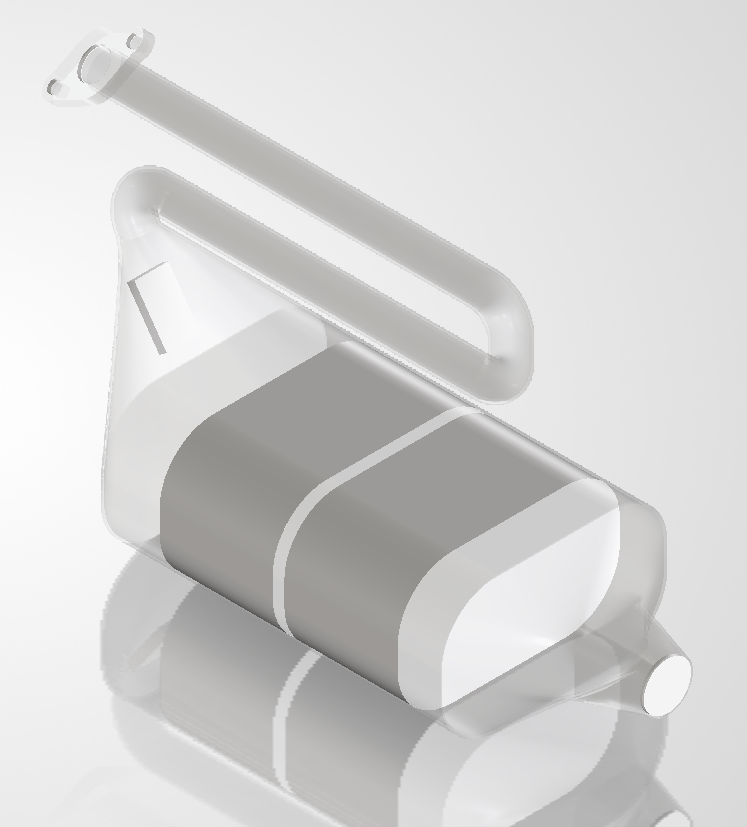
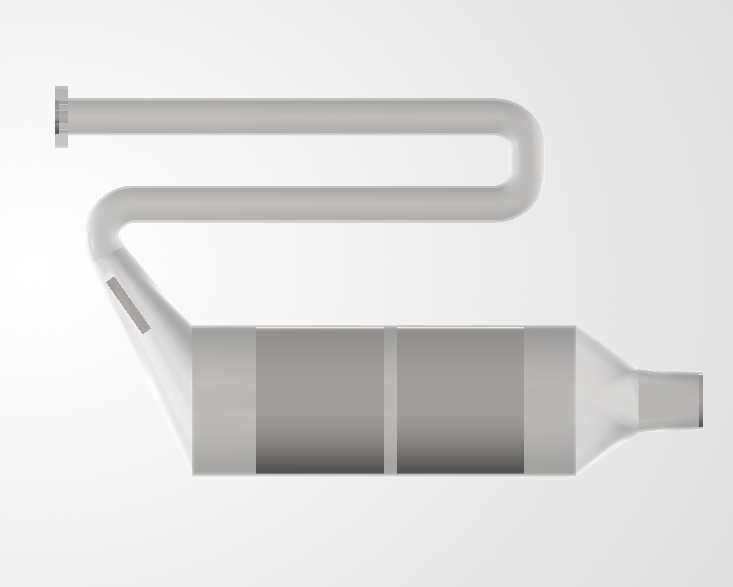
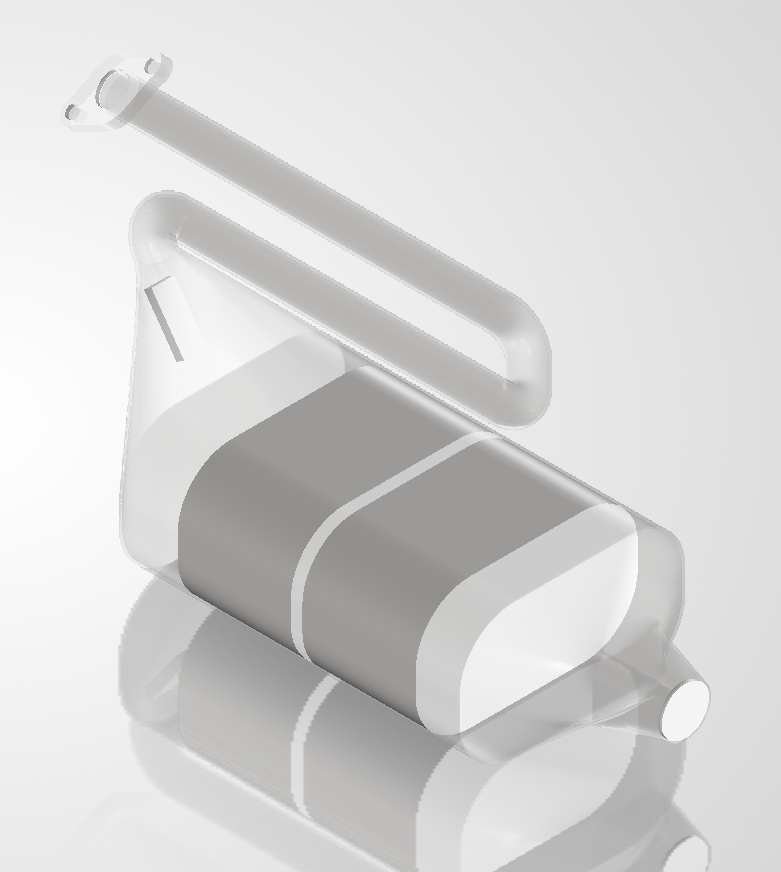
Physical Setup & Geometry
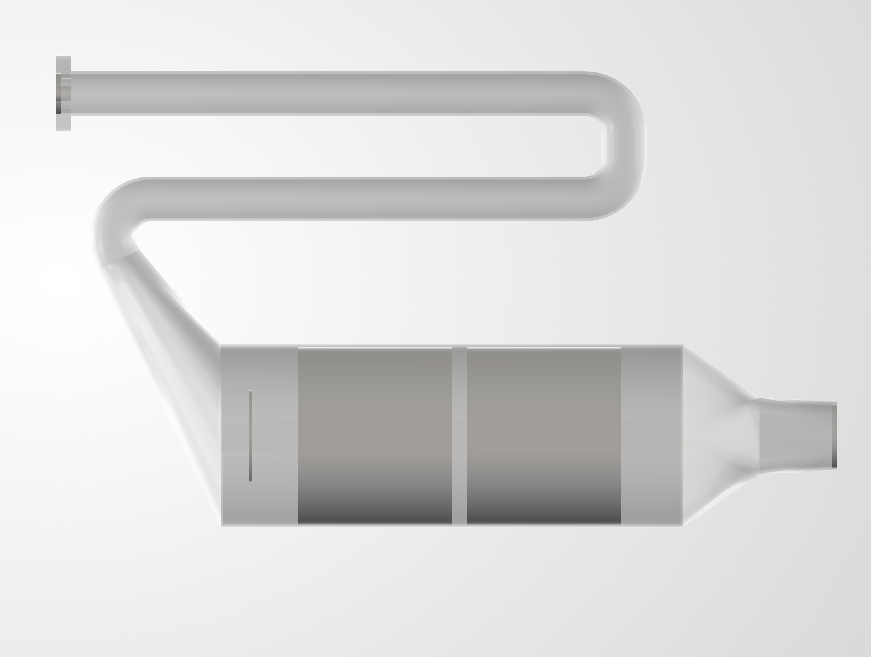
The converter geometry contains:
- Inlet pipe, 10 m/s velocity inlet, air cold-flow
- Two isotropic porous catalyst blocks, pressure-drop and flow-distribution targets
- Outlet, static pressure at 101,325 Pa
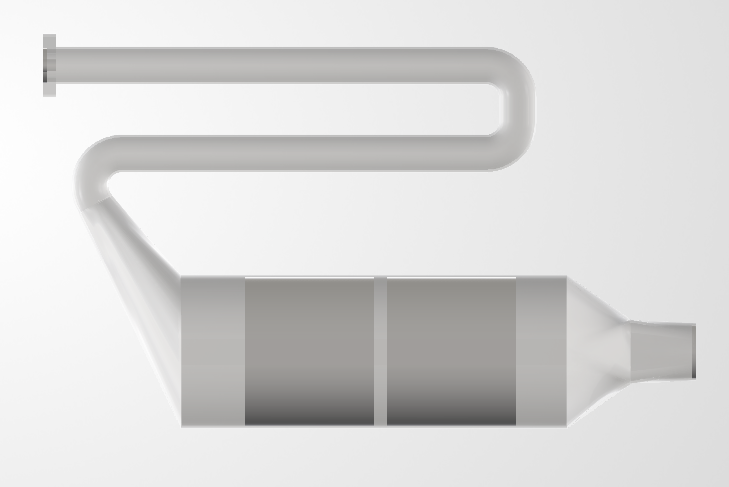
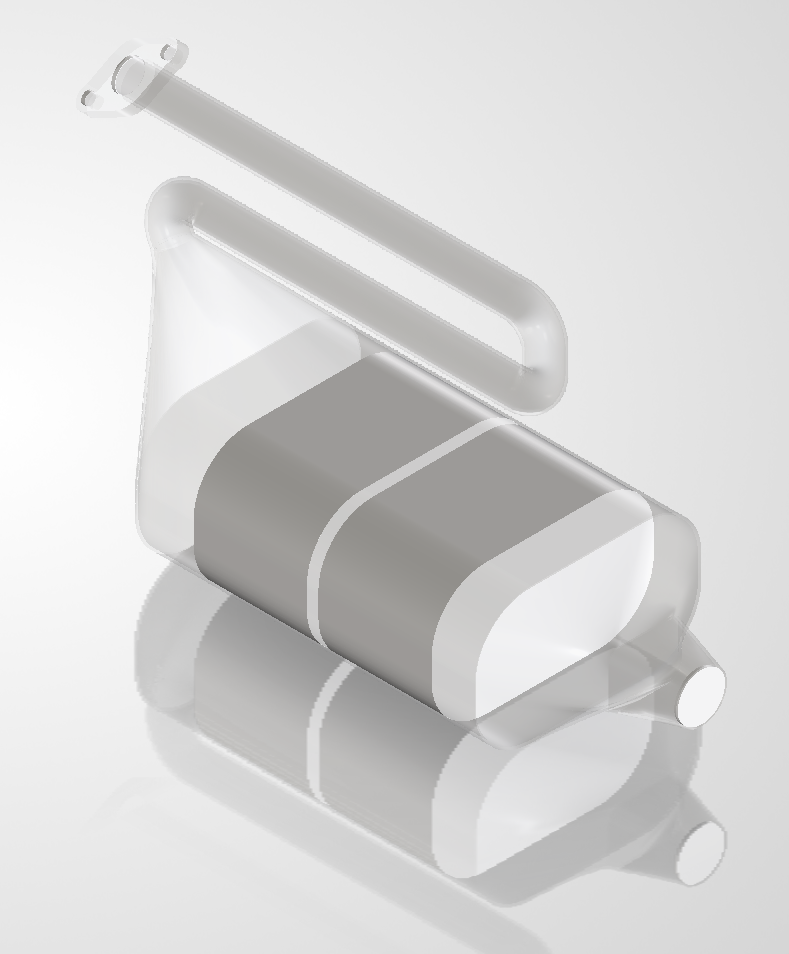
The geometry was created in SolidWorks and the flow study set up as an internal analysis. Catalyst blocks are modelled as porous media rather than resolving individual honeycomb channels, this keeps the model computationally light while preserving the pressure-drop and flow-distribution trends needed for design comparison. All cases are run at basic mesh settings for quick evaluation.
Simulation Setup
| Parameter | Value |
|---|---|
| Analysis type | Internal flow |
| Fluid | Air, cold-flow |
| Inlet condition | Velocity inlet, 10 m/s for all cases |
| Outlet condition | Static pressure, 101,325 Pa |
| Catalyst approximation | Two isotropic porous media blocks |
| Porous media reference area | 20,758 mm² (0.020758 m²) |
| Porous media reference length | 100 mm (0.1 m) |
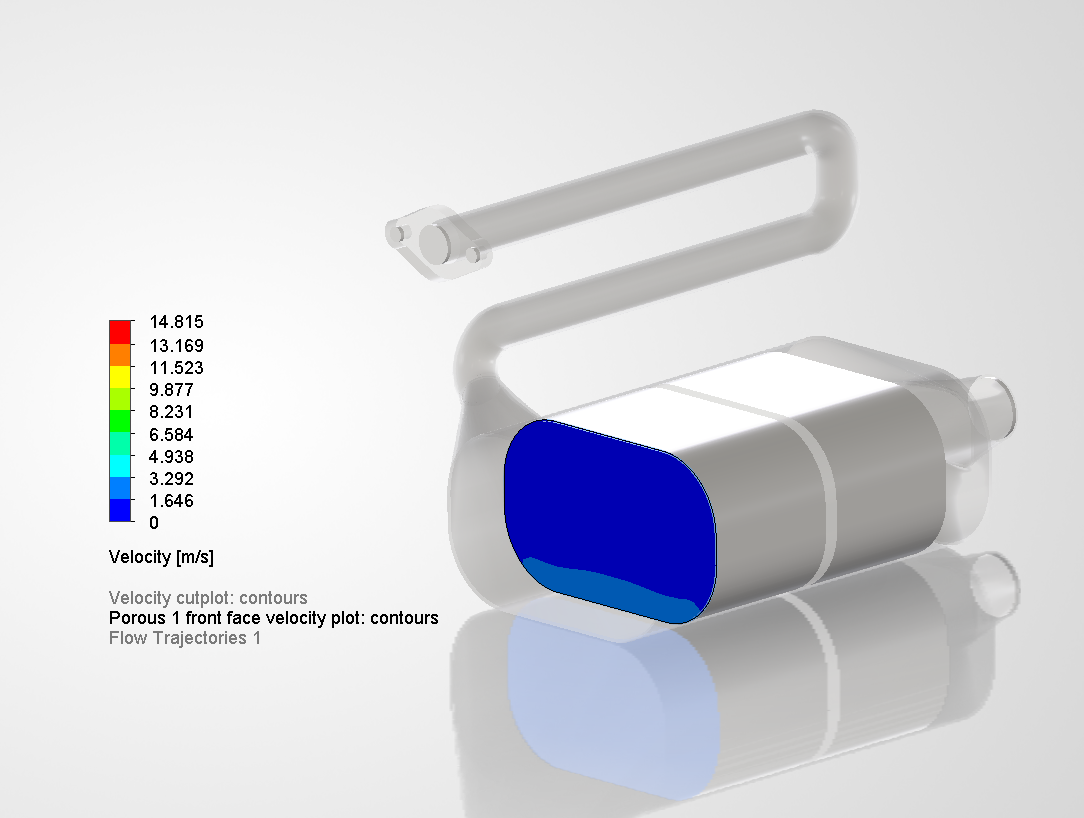
| Primary metric | Velocity uniformity ratio at Porous Block 1 front face |
| Secondary metric | Total converter pressure drop |
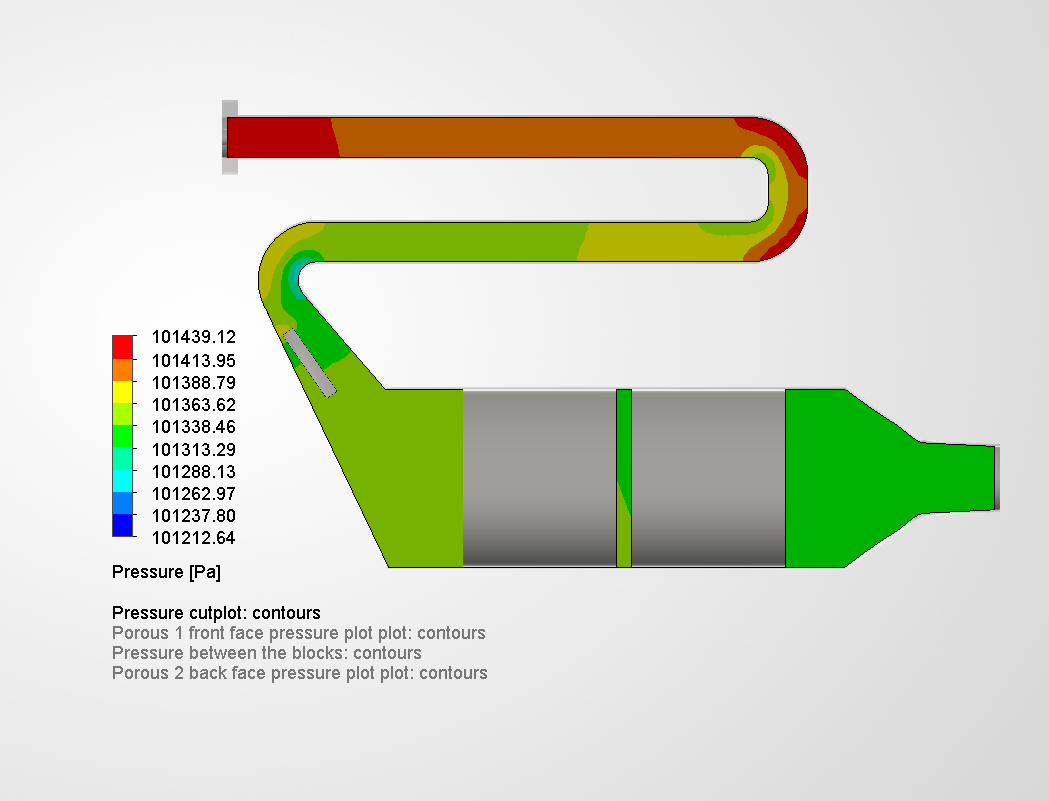
Goal Equations
Both comparison metrics are equation goals extracted using the Averaged Value column:
- Velocity uniformity ratio = Max velocity at Porous 1 front face ÷ Average velocity at Porous 1 front face
- Total converter pressure drop = Inlet average static pressure − Outlet static pressure
The uniformity ratio is dimensionless, velocity units cancel in the division. A ratio of 1.0 is perfect uniformity; higher values indicate greater maldistribution.
Design Case Overview
| Case | Configuration | Uniformity Ratio | vs Baseline | Total DP (Pa) | vs Baseline | Decision |
|---|---|---|---|---|---|---|
| 1 | Baseline, no baffle | 2.832 | , | 114.065 | , | Reference |
| 2 | Circular baffle | 3.587 | −26.7% | 112.079 | −1.7% | Rejected |
| 3 | Guided vane, 4 mm thick, 30 mm wide, 80 mm | 2.557 | +9.7% | 106.901 | +6.3% | Improved |
| 4 | Guided vane, 4 mm thick, 20 mm wide, 90 mm | 2.602 | +8.1% | 110.016 | +3.5% | Improved |
| 5 | Guided vane, 8 mm thick, 30 mm wide, 80 mm | 1.990 | +29.7% | 96.588 | +15.3% | Improved |
| 6 | Guided vane, 8 mm thick, 20 mm wide, 90 mm | 1.540 | +45.6% | 93.120 | +18.4% | Best |
Uniformity ratio: lower = better. Pressure drop: lower = better.
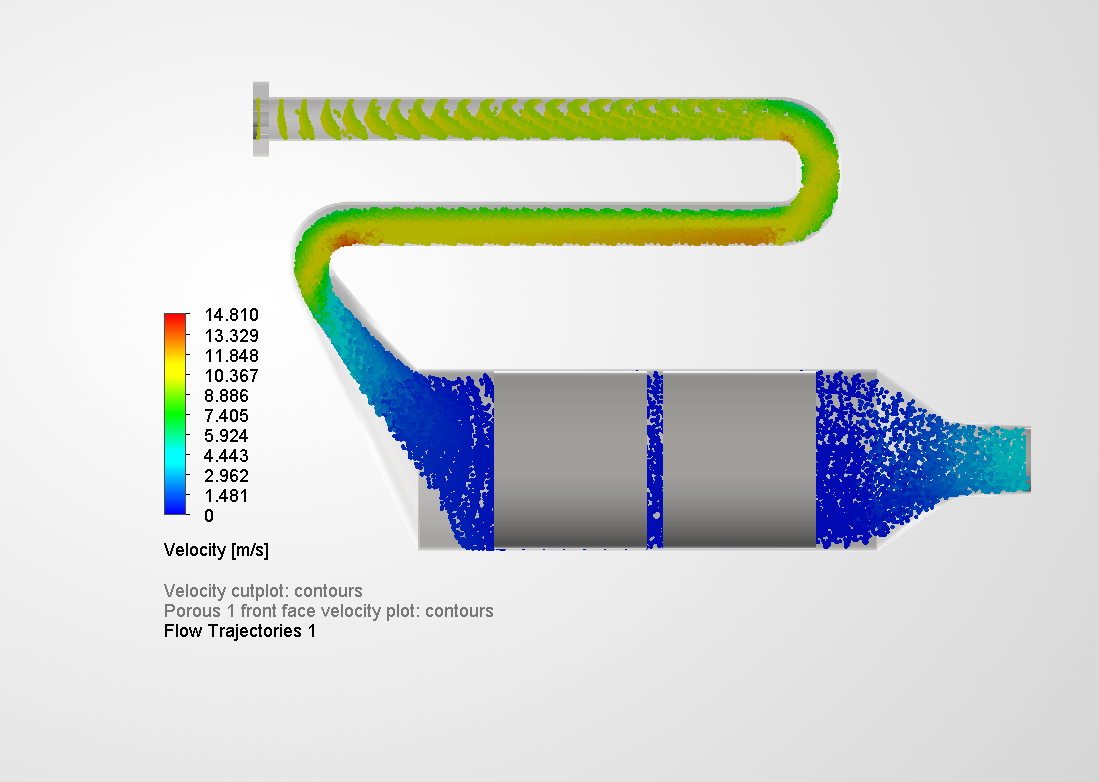
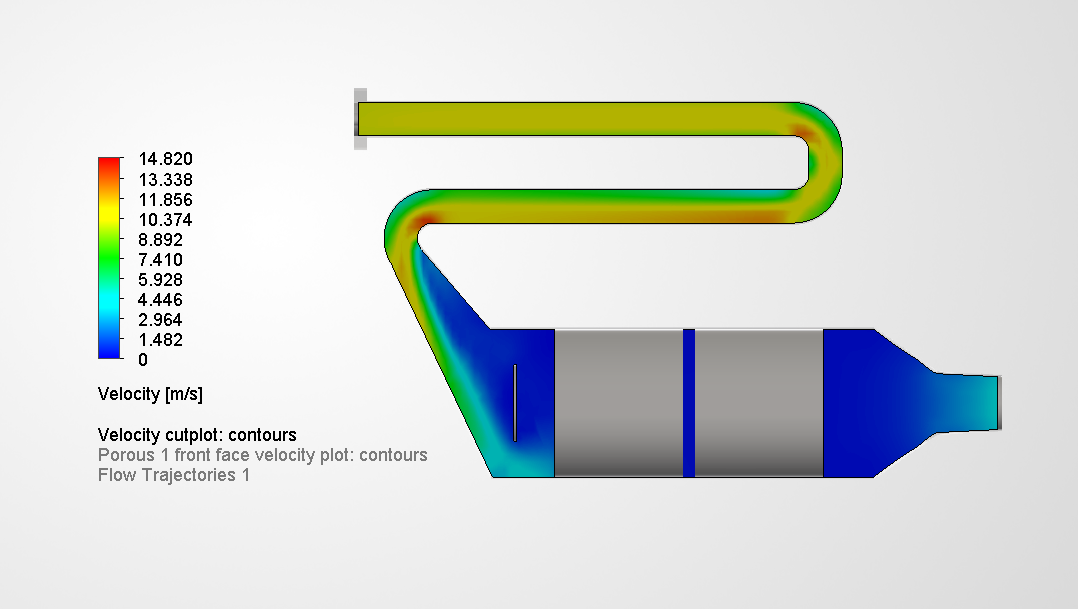
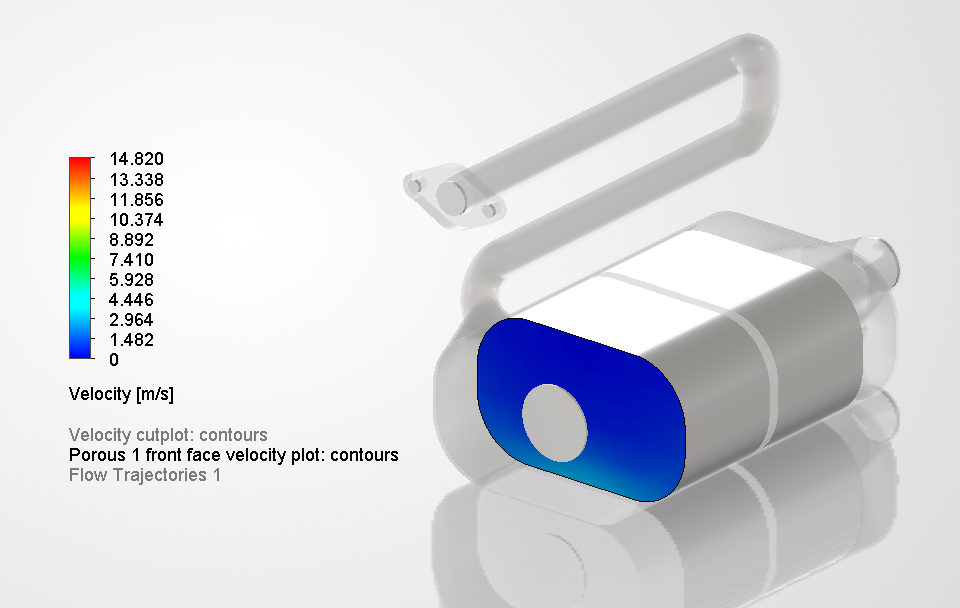
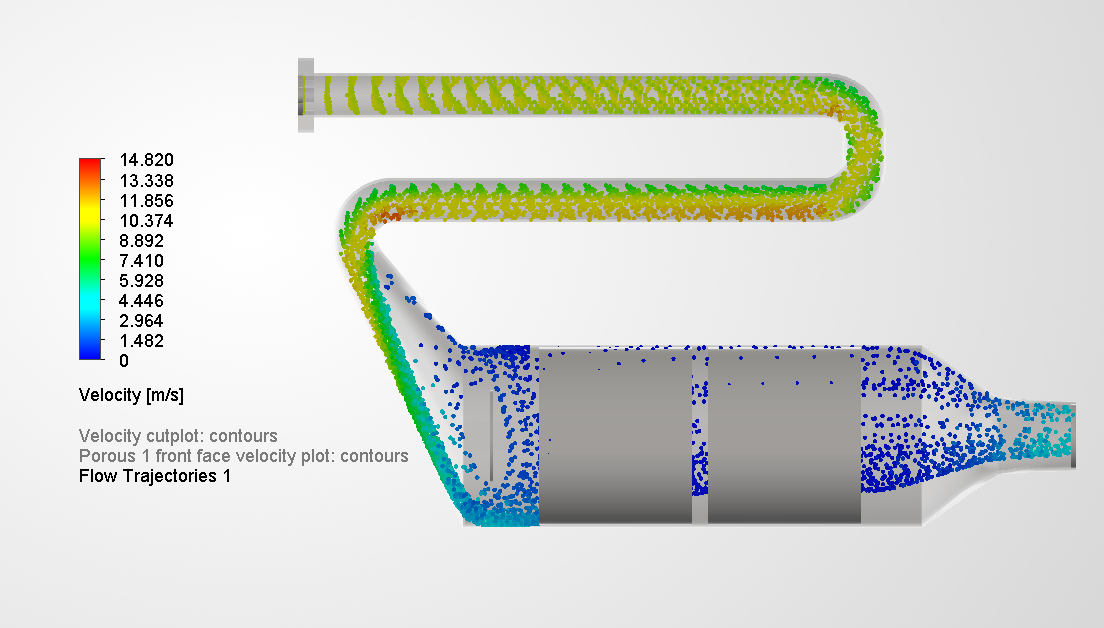
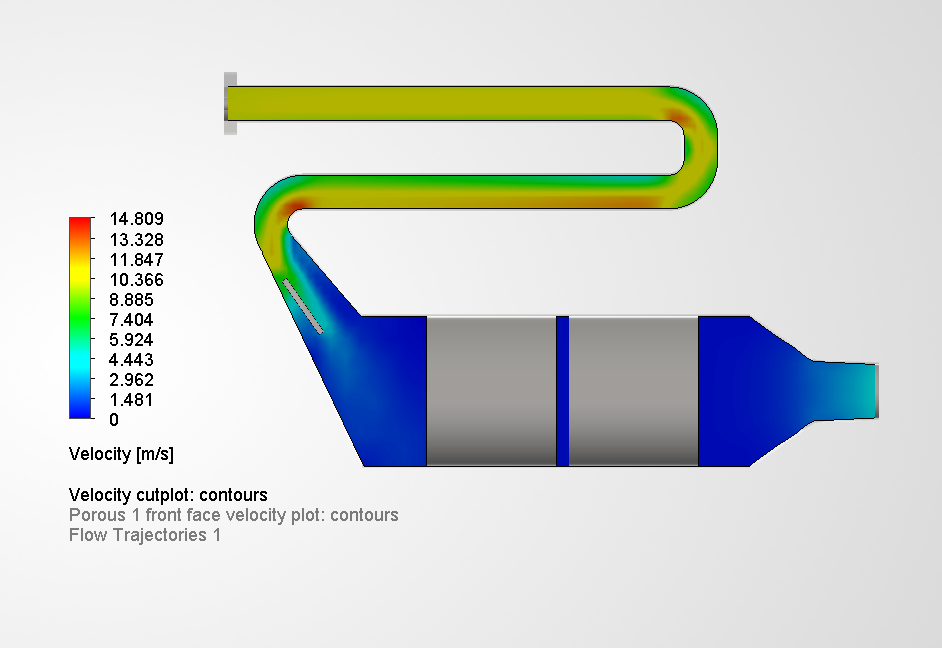
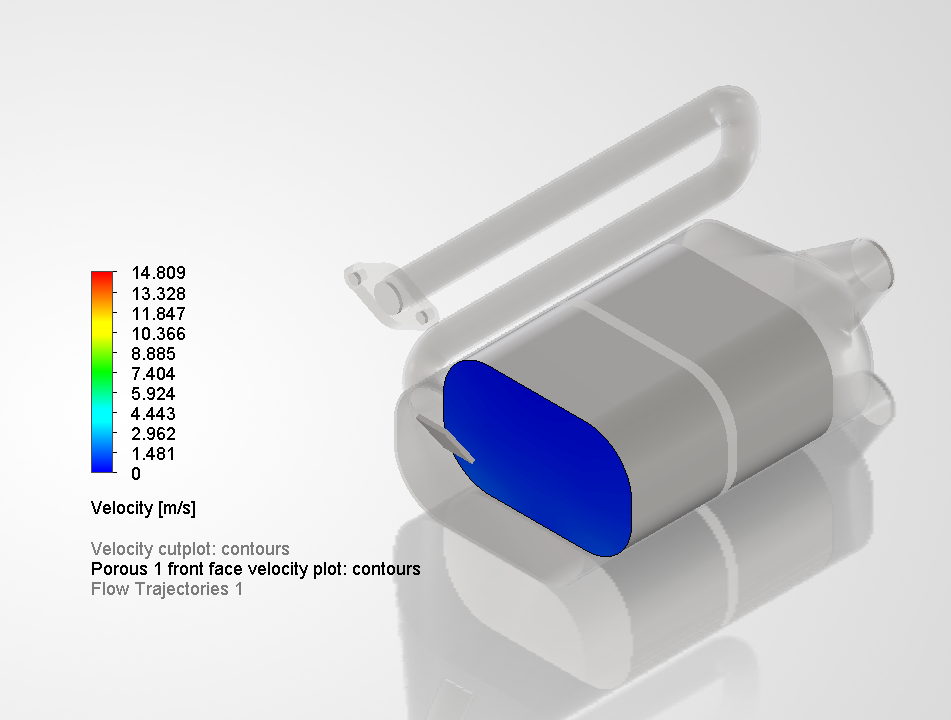
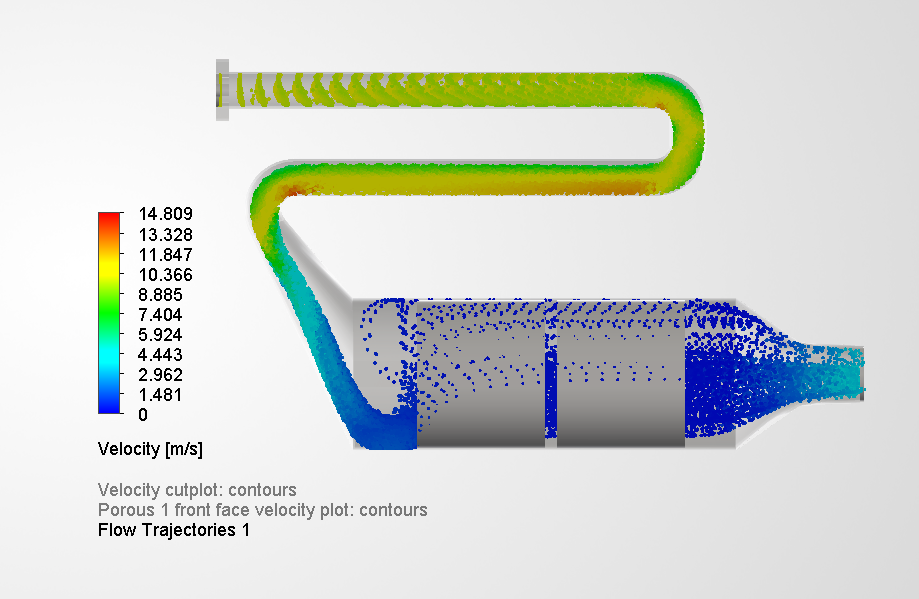
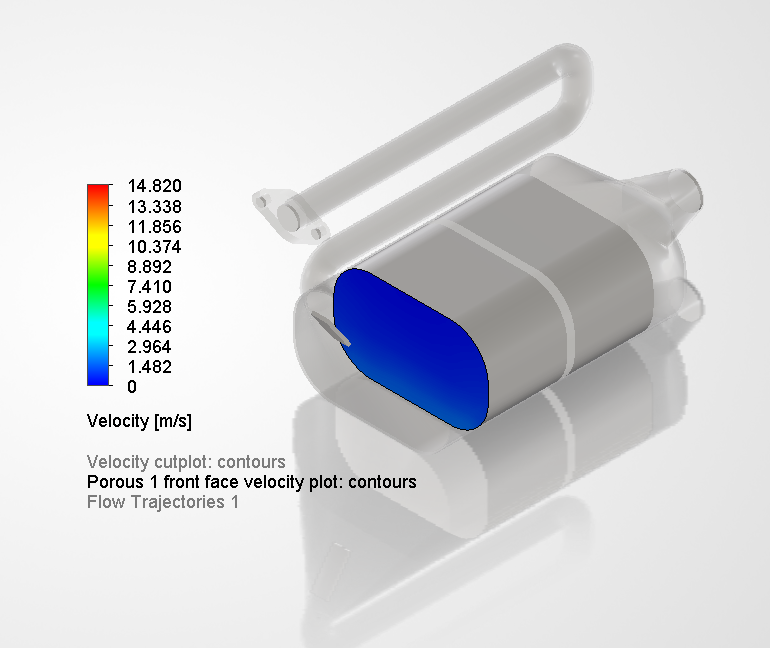
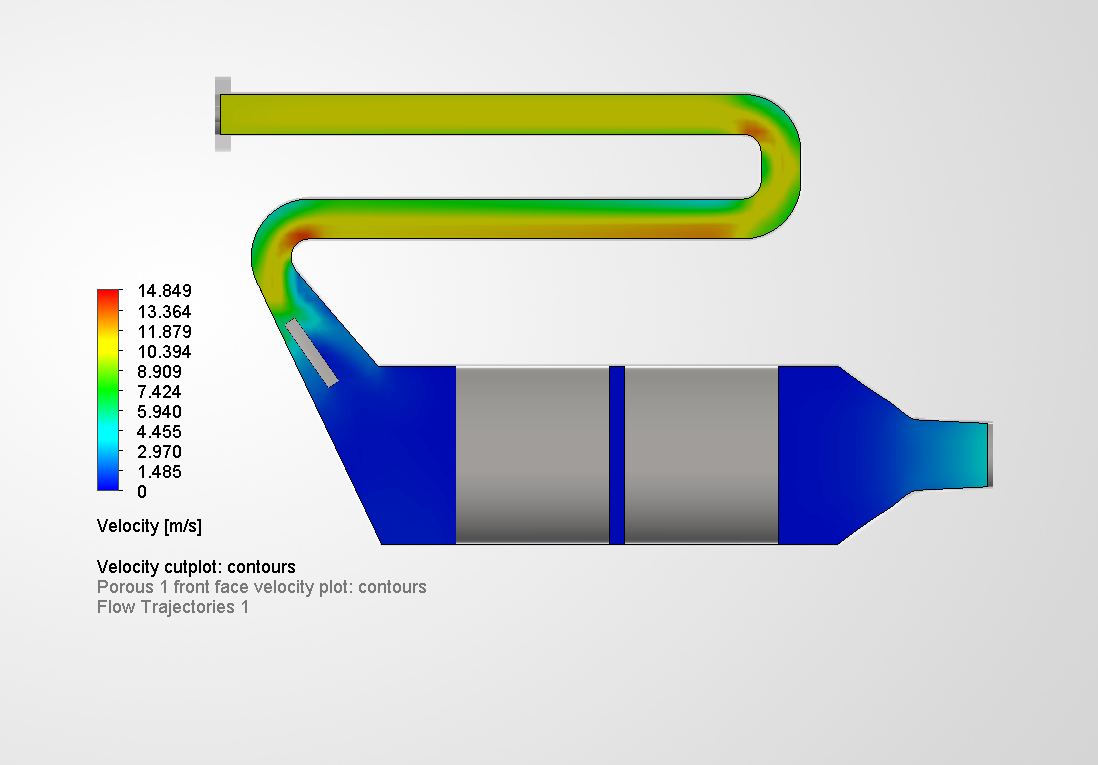
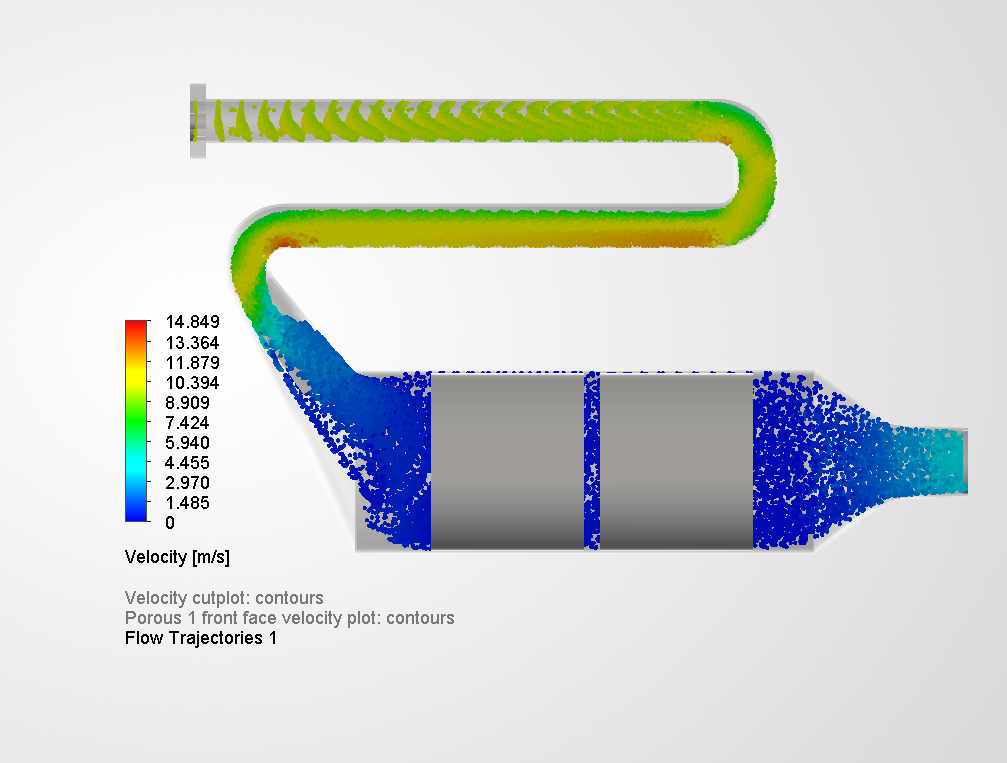
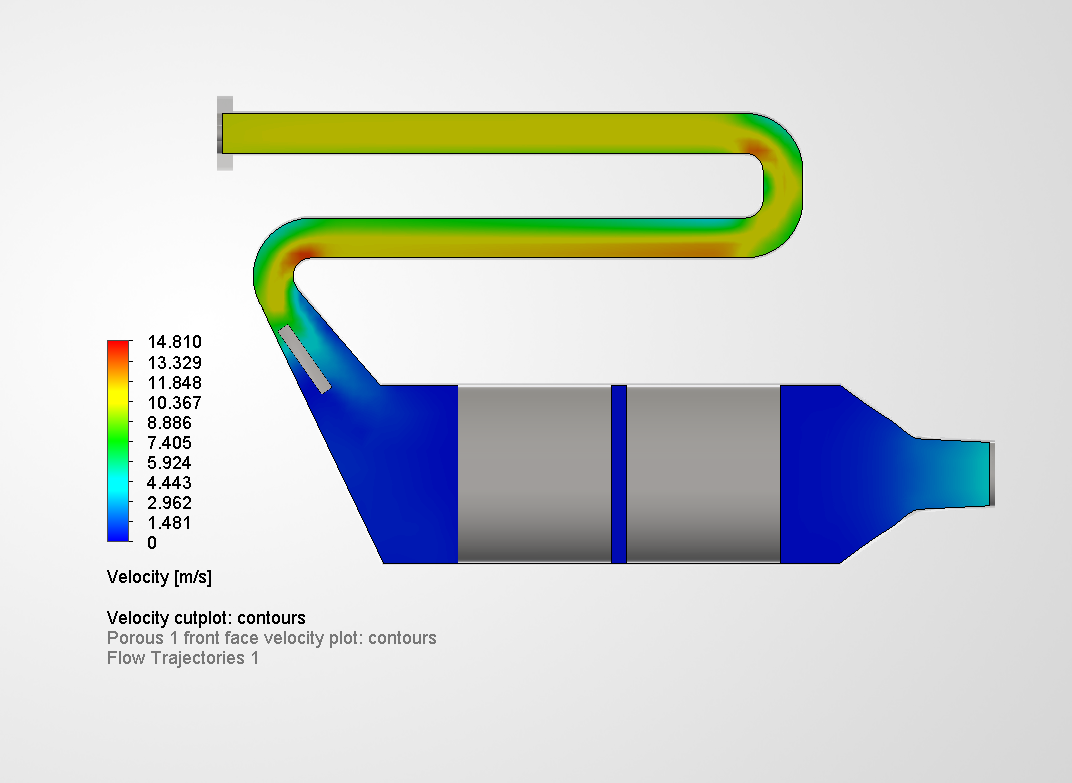
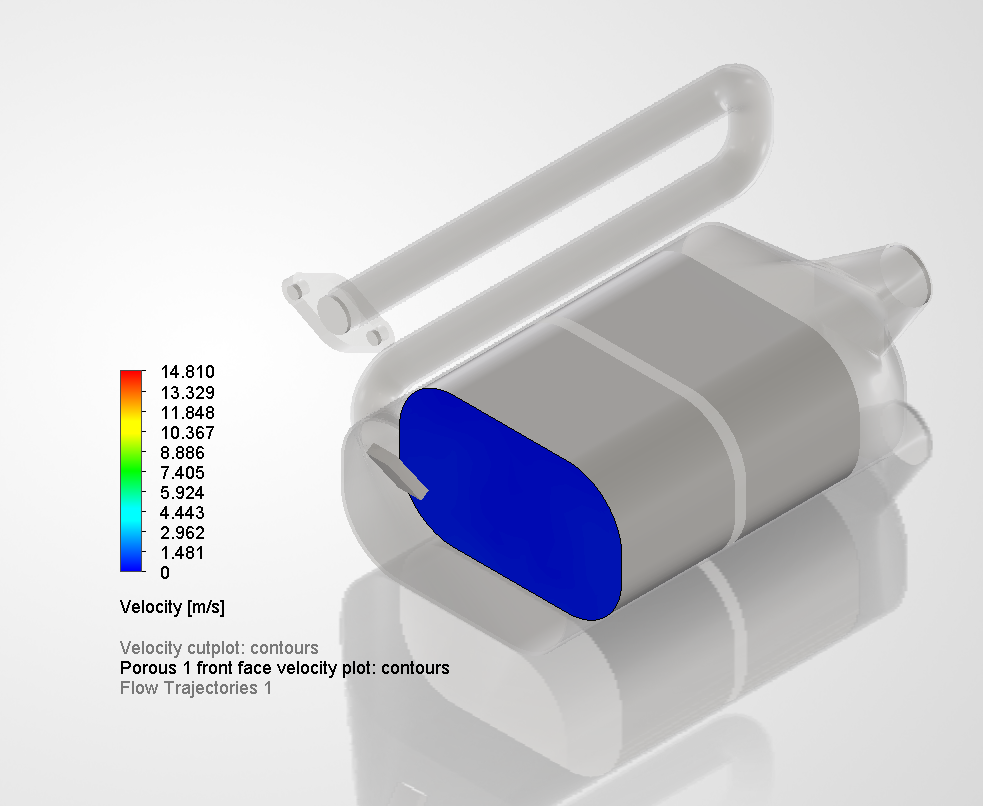
Case 1, Baseline: No Baffle
The unmodified converter geometry with two porous catalyst blocks and no additional flow-control feature.
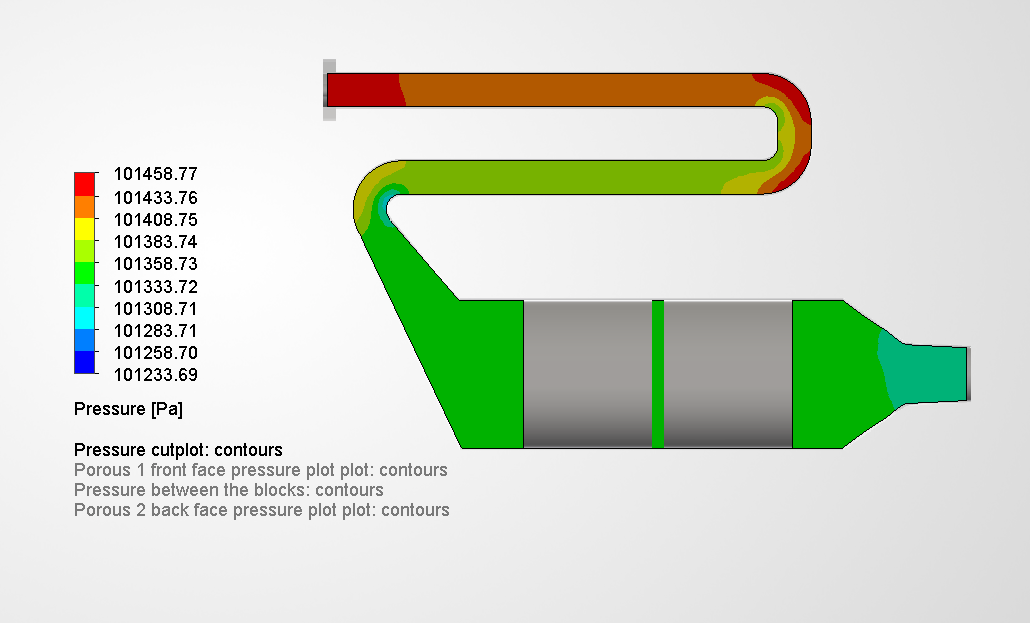
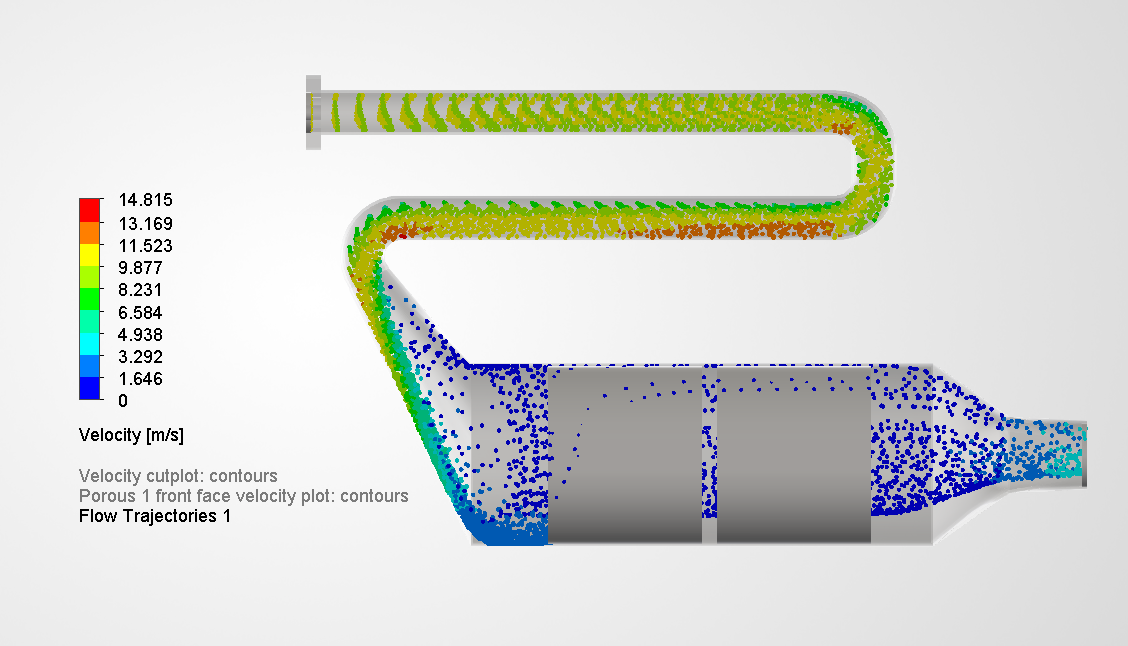
Uniformity ratio: 2.832 · Total DP: 114.065 Pa · P1 avg/max velocity: 1.203 / 3.406 m/s
The inlet jet reaches the first catalyst face with a concentrated high-velocity core. The ratio of 2.832 confirms that peak velocity is nearly three times the face-averaged value, strong maldistribution.
Case 2, Circular Baffle
A circular baffle placed upstream of the first porous block to block the inlet jet directly.
Uniformity ratio: 3.587 · Total DP: 112.079 Pa · P1 avg/max velocity: 1.120 / 4.016 m/s
Rejected. Simply blocking the inlet jet accelerates flow around the baffle edges and increases the uniformity ratio to 3.587, worse than the unmodified baseline. This confirms that jet-blocking without redirection is counterproductive.
Case 3, Guided Vane: 4 mm Thick, 30 mm Wide, 80 mm Location
First guided vane concept. The vane redirects the inlet jet gradually rather than blocking it.
Uniformity ratio: 2.557 · Total DP: 106.901 Pa · P1 avg/max velocity: 0.752 / 1.924 m/s
Case 4, Guided Vane: 4 mm Thick, 20 mm Wide, 90 mm Location
Narrower 4 mm vane placed closer to the catalyst inlet.
Uniformity ratio: 2.602 · Total DP: 110.016 Pa · P1 avg/max velocity: 0.935 / 2.434 m/s
Case 5, Guided Vane: 8 mm Thick, 30 mm Wide, 80 mm Location
Increasing vane thickness to 8 mm while keeping the 30 mm width and 80 mm location from Case 3.
Uniformity ratio: 1.990 · Total DP: 96.588 Pa · P1 avg/max velocity: 0.434 / 0.863 m/s
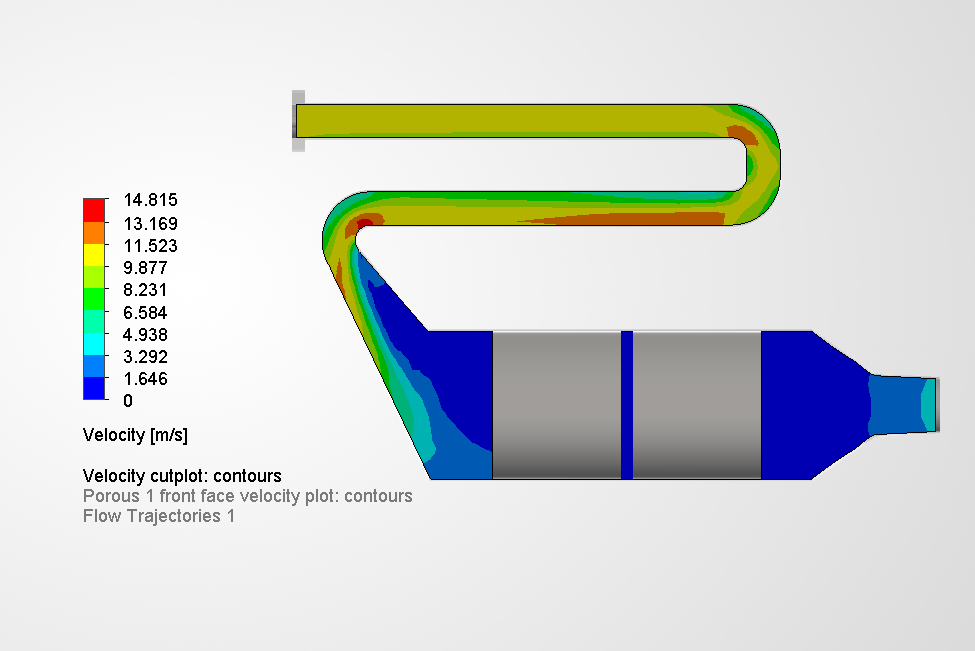
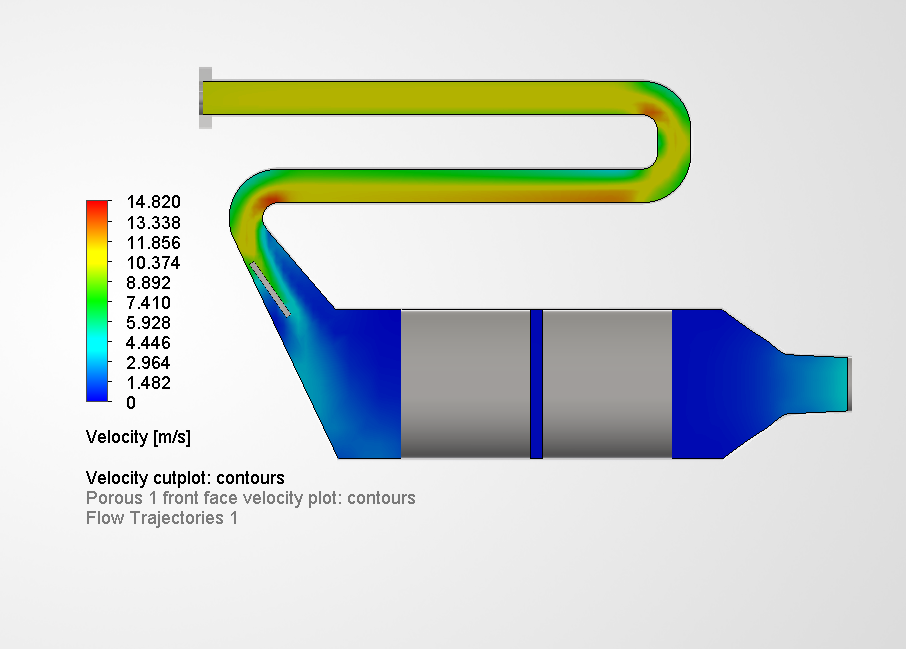
Case 6, Guided Vane: 8 mm Thick, 20 mm Wide, 90 mm Location (Final Design)
Reduced width and shifted the vane closer to the inlet. This is the best performing configuration.
Uniformity ratio: 1.540 · Total DP: 93.120 Pa · P1 avg/max velocity: 0.412 / 0.635 m/s
Results & Engineering Conclusions
Key findings
Blocking a jet is not the same as redirecting it. The circular baffle (Case 2) worsened flow distribution to a ratio of 3.587, higher than the 2.832 baseline, because it forced flow around its edges, creating accelerated peripheral jets. Guided vanes that redirect rather than obstruct were consistently superior.
Vane thickness is the dominant design variable. Doubling thickness from 4 mm to 8 mm (Cases 3→5) reduced the uniformity ratio by 22% and cut total pressure drop by 9.6 Pa. Width and axial position produced smaller but still measurable improvements.
The final design improves both objectives simultaneously. The 8 mm guided vane (Case 6) achieved a 45.6% improvement in uniformity ratio and an 18.4% reduction in total pressure drop compared to baseline, demonstrating that flow redirection does not require a pressure-drop penalty when the vane geometry is well-tuned.
Porous media approximation is valid for design comparison. Mass flow balance was confirmed in every case (inlet and outlet magnitudes match). The porous media model is appropriate for relative trend analysis; absolute quantitative results would require directional resistance coefficients and mesh sensitivity validation before use in final design decisions.
Final Design Comparison
| Metric | Baseline (Case 1) | Final Design (Case 6) | Improvement |
|---|---|---|---|
| Velocity uniformity ratio | 2.832 | 1.540 | 45.6% lower |
| Total converter pressure drop | 114.065 Pa | 93.120 Pa | 18.4% lower |
| Porous Block 1 max velocity | 3.406 m/s | 0.635 m/s | 81.4% lower |
| Porous Block 1 avg velocity | 1.203 m/s | 0.412 m/s | 65.8% lower |
Numerical Results, All Cases
| Case | Inlet MF (kg/s) | Outlet MF (kg/s) | P1 Avg V (m/s) | P1 Max V (m/s) | Uniformity | DP P1 (Pa) | DP P2 (Pa) | Total Porous DP (Pa) | Total DP (Pa) |
|---|---|---|---|---|---|---|---|---|---|
| 1 | 0.006056 | −0.006056 | 1.203 | 3.406 | 2.832 | 2.528 | 3.641 | 6.205 | 114.065 |
| 2 | 0.006056 | −0.006056 | 1.120 | 4.016 | 3.587 | 2.504 | 3.647 | 6.187 | 112.079 |
| 3 | 0.006055 | −0.006055 | 0.752 | 1.924 | 2.557 | 3.498 | 3.659 | 7.193 | 106.901 |
| 4 | 0.006055 | −0.006055 | 0.935 | 2.434 | 2.602 | 3.114 | 3.655 | 6.805 | 110.016 |
| 5 | 0.006054 | −0.006054 | 0.434 | 0.863 | 1.990 | 3.874 | 3.658 | 7.569 | 96.588 |
| 6 | 0.006054 | −0.006054 | 0.412 | 0.635 | 1.540 | 3.882 | 3.658 | 7.576 | 93.120 |
Limitations & Next Steps
- Isotropic porous media, real catalytic converter honeycombs are directionally porous, with low resistance along channels and high resistance radially. A directional resistance model would give more accurate absolute pressure-drop values.
- Cold-flow study, thermal effects, exhaust gas composition, transient pulsation from the engine, and catalytic heat generation are not included. A hot-flow study would be needed for thermal sizing.
- Mesh sensitivity, current results are most reliable for relative comparison. A mesh sensitivity study comparing global and locally refined settings should precede any use of absolute values for final design decisions.
- Future directions, directional porous media, elevated flow rates, thermal coupling, and a broader geometric sweep of vane angle and position.